
Connect to a verified Solana RPC node
Before you can analyze on-chain activity, you need a direct line to the Solana ledger. An RPC (Remote Procedure Call) node acts as your gateway, translating your requests into blockchain data. Without a reliable node, your analytics tools will return errors or incomplete results.
For Solana specifically, the most robust way to access this data is through the Geyser plugin or a specialized RPC provider. Unlike generic Ethereum nodes, Solana’s architecture benefits from providers that support Geyser, which allows for real-time notification of state changes. This is critical for tracking live transactions, token swaps, and NFT mints without lag.
Choose a provider that offers high availability and low latency. Official documentation and major analytics platforms like Token Terminal and DeFiLlama rely on these connections to serve their users. Verify that your chosen endpoint supports the specific data types you need, such as program logs or account updates.
Once you have your API key or endpoint URL, test the connection with a simple request for the latest block height. If the node responds quickly and accurately, you are ready to move on to querying specific accounts or transactions.
Track active addresses and transaction volume
Understanding Solana on-chain analytics starts with two core metrics: daily active addresses and transaction volume. These numbers tell you who is using the network and how intensely they are using it. High transaction counts with low active addresses often indicate bot activity or high-frequency trading bots, while a rise in unique active addresses signals genuine user adoption.
To track these metrics accurately, use The Block’s Solana data dashboard. It provides real-time updates on daily active users, transaction counts, and total fees paid. This official source strips away noise, letting you see the raw flow of capital and attention across the ecosystem. You can also cross-reference this with Solana’s own validator data to verify network health during peak loads.
When analyzing these figures, look for correlation. For instance, during major meme coin launches or new DEX deployments, transaction volume spikes before active addresses catch up. This lag is a critical signal. It suggests early speculative interest that may or may not convert to sustained usage. By monitoring the gap between these two metrics, you can gauge whether network activity is organic or artificially inflated.
Monitor fee structures and validator performance
To predict transaction costs and ensure network reliability, you must move beyond raw speed metrics and examine the underlying fee structures and validator health. Solana’s 2026 roadmap shifts focus from maximum throughput to predictability, resilience, and fairness, making these operational metrics critical for both enterprise and retail users [[src-serp-2]].
Check transaction fee trends
Solana’s fee structure is dynamic, influenced by network congestion and priority fees. Use the Blockworks Solana On-Chain Metrics dashboard to track active addresses, total fees, and fee breakdowns in real time [[src-serp-1]]. Look for spikes in priority fees, which indicate demand for faster inclusion. Consistent low fees suggest a healthy, uncongested network, while erratic spikes may signal upcoming bottlenecks.
Verify validator uptime
Validator performance directly impacts block production consistency. High uptime ensures that transactions are processed without unnecessary delays. Monitor validator slippage and missed slots through official Solana explorers or third-party analytics providers. A drop in uptime often precedes network instability, so tracking this data helps you anticipate potential service interruptions.
Compare RPC provider reliability
For developers and enterprises, the choice of RPC provider affects both latency and cost. The table below compares three top Solana RPC providers based on key performance indicators relevant to 2026 network conditions.
| Provider | Avg Latency | Uptime | Cost Model |
|---|---|---|---|
| Provider A | 120ms | 99.9% | Pay-per-request |
| Provider B | 85ms | 99.95% | Subscription |
| Provider C | 150ms | 99.8% | Free Tier |
Use Geyser plugins for custom data streams
Geyser is Solana’s plugin architecture that exposes real-time transaction and state updates directly to external services. Unlike standard RPC polling, which requires you to repeatedly query the network, Geyser pushes data to your application the moment it lands on the blockchain. This makes it the preferred method for building low-latency trading bots, custom dashboards, or specialized protocol monitors.
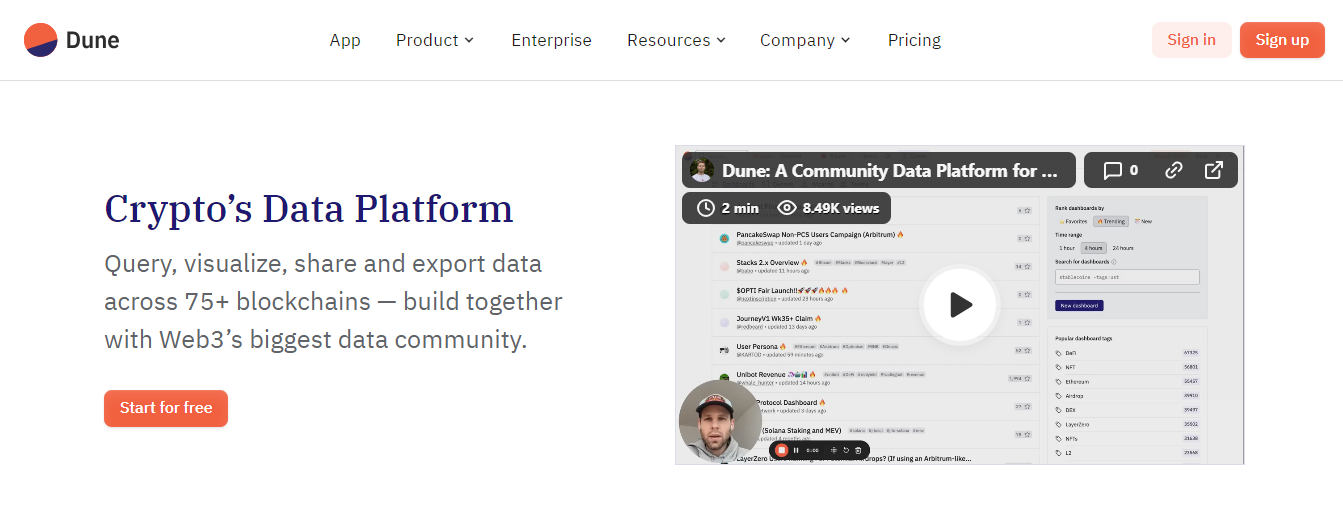
Solana does not host Geyser plugins directly; you must subscribe to a node provider that offers Geyser access. Providers like Helius, Triton, and Shyft maintain high-throughput nodes that expose the Geyser interface. Compare their rate limits and subscription tiers before choosing, as real-time streams can consume bandwidth quickly. For most developers, Helius is the most documented entry point.
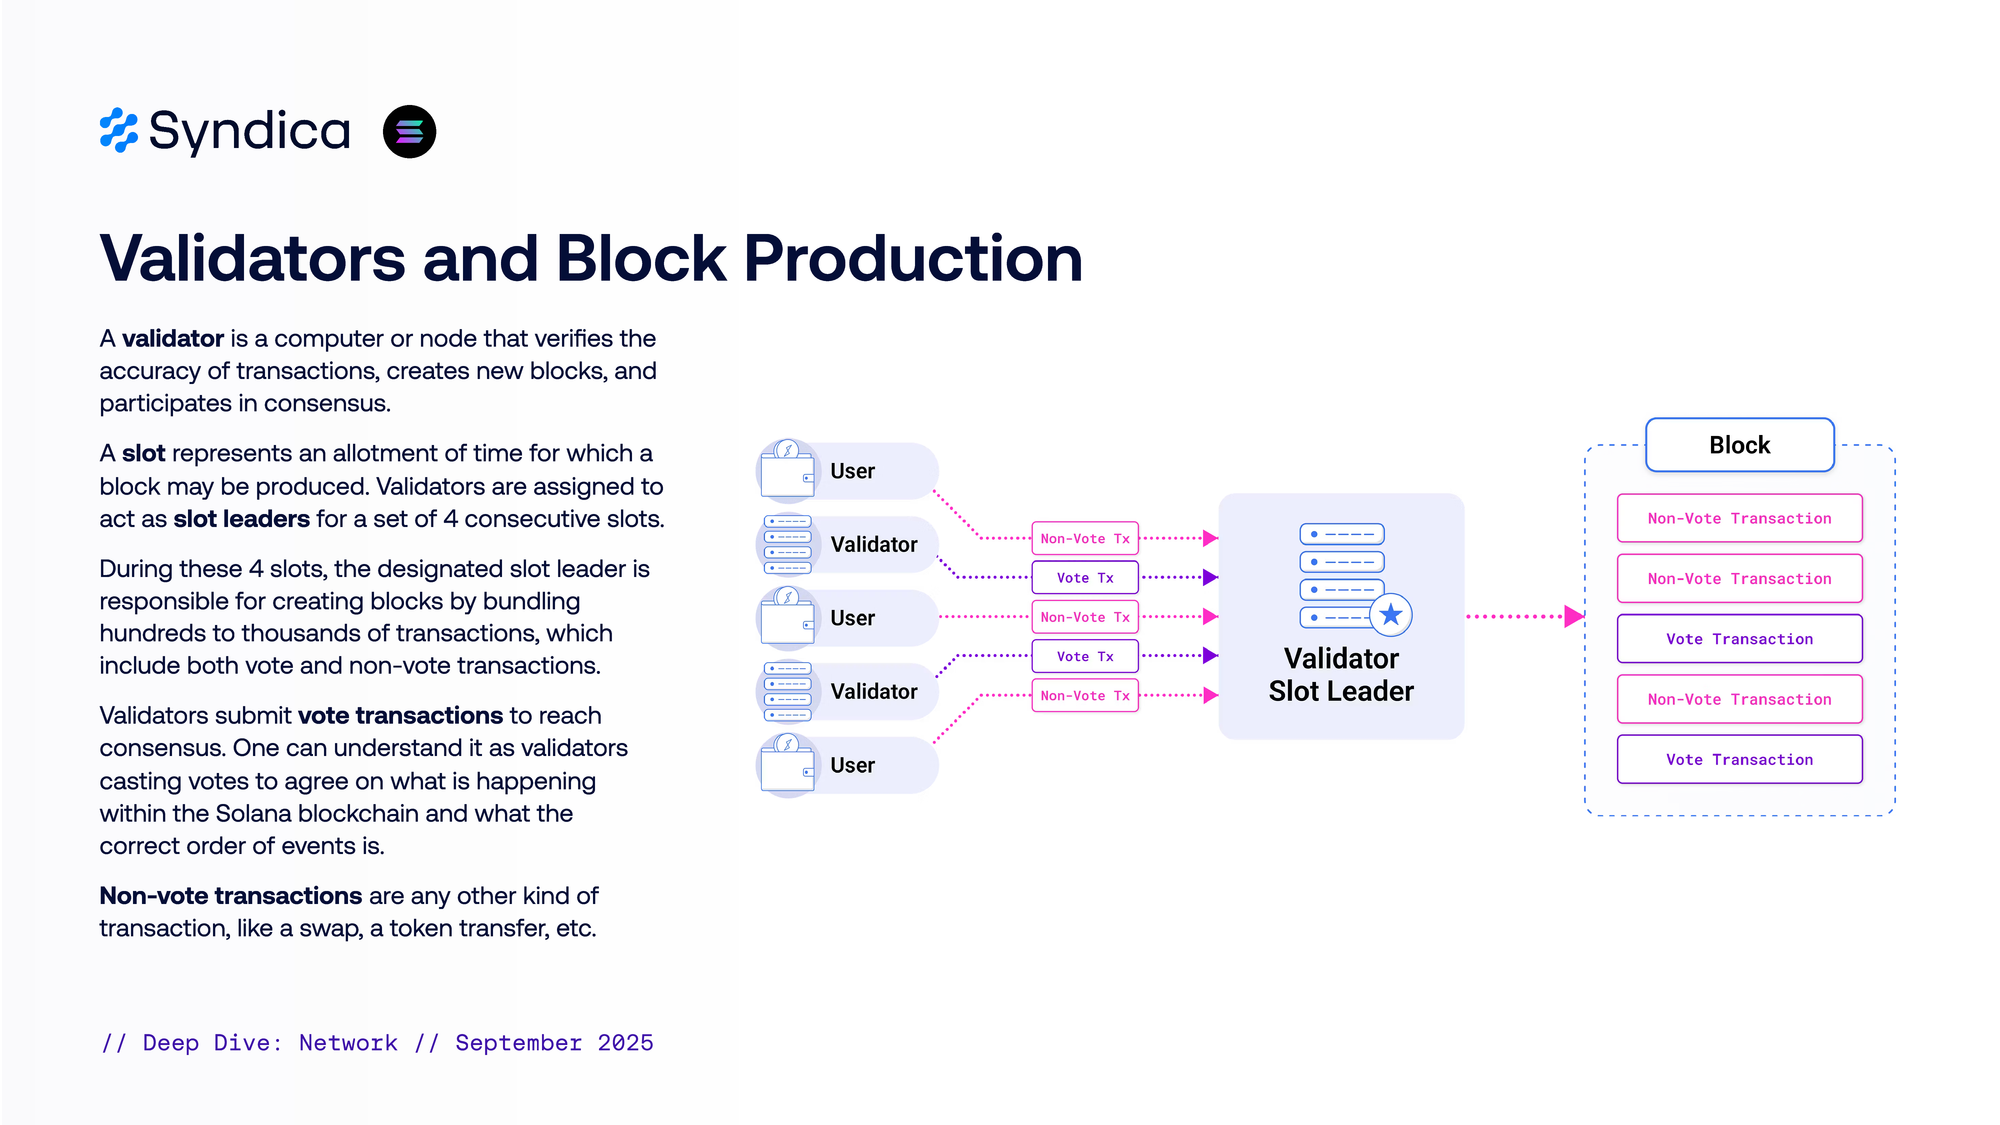
Connect to your provider’s WebSocket endpoint using the Solana web3 library. You must explicitly declare which accounts or transactions you want to track. Filtering at the subscription level is critical; subscribing to all transactions will overwhelm your memory and the provider’s connection limit. Define filters for specific token mints or program IDs relevant to your analytics.
Write a listener function that processes incoming Geyser events. Each event contains the raw transaction data, account state updates, and slot information. Parse the JSON payloads to extract relevant fields like signer addresses, token amounts, and program instructions. Ensure your handler is non-blocking to prevent backpressure from slowing down the real-time stream.

Raw Geyser streams are ephemeral. To build meaningful analytics, you must persist the data to a database. Use a time-series database like TimescaleDB or a document store like MongoDB to index transactions by time and asset. This allows you to run historical queries and calculate metrics like volume or holder growth over time.
Verify institutional adoption metrics
Tracking Solana on-chain analytics requires verifying specific institutional signals rather than relying on general price action. The primary metric for assessing long-term network value is Real World Asset (RWA) tokenization volume. This segment represents the bridge between traditional finance and the blockchain, providing a stable base of locked value.
To verify these metrics, start by checking the official Solana ecosystem updates. As of May 2026, the network reported an RWA all-time high exceeding $2.8 billion, with tokenized equities capturing a 97% share of that specific vertical. Reviewing Solana News provides the most direct, primary-source confirmation of these inflows without third-party interpretation.
Next, monitor stablecoin supply as a proxy for institutional liquidity. A stablecoin supply of $16.4 billion indicates significant capital deployment readiness. High stablecoin volumes on Solana often precede large-scale DeFi activity or RWA settlements, serving as an early warning system for institutional entry. Cross-reference these figures with ETF inflow data from major issuers to complete the picture of institutional adoption.
Common pitfalls in Solana data verification
Relying on delayed data is the most frequent error in Solana on-chain analytics. Public RPC nodes often lag behind the actual block production, meaning your charts might show a transaction as pending when it has already confirmed. Always verify the latest block height against a primary source like The Block’s Solana metrics before acting on time-sensitive signals.
Ignoring MEV (Maximal Extractable Value) tips can also skew your perception of network activity. Standard dashboards frequently omit Jito tips and bundle fees, presenting a cleaner but less accurate picture of validator revenue and transaction costs. Failing to account for these hidden fees leads to incorrect profit/loss calculations for high-frequency traders.
Misinterpreting RPC rate limits is another critical mistake. Many free or shared endpoints enforce strict request limits that trigger silent failures or partial data returns. If your analytics tool stops updating abruptly, check your API usage logs rather than assuming the network has stalled.
Use this checklist to validate your data sources before executing trades:
-
Confirm block height matches a primary explorer (e.g., Solana Explorer).
-
Include Jito tips in fee calculations.
-
Verify RPC endpoint latency and rate limit status.
-
Cross-reference active addresses with multiple data providers.
Frequently asked questions about Solana analytics
Helpful gear
Use these product recommendations as a starting point, then choose the size, material, and price point that fit how you actually use the gear.

As an Amazon Associate, we may earn from qualifying purchases.
No comments yet. Be the first to share your thoughts!