On October 11,2025, the Solana blockchain made headlines across the crypto world by achieving a peak transaction throughput of 107,540 transactions per second (TPS) during a live stress test. This event not only set a new industry benchmark but also reignited debates about network scalability and real-world usability. With Binance-Peg SOL trading at $183.28 as of today, Solana’s technical performance is under intense scrutiny by investors and developers alike.

Breaking Down the 100,000 TPS Milestone
The record-breaking figure was achieved using so-called “noop” program calls, lightweight transactions that do not alter on-chain state. These are often used in controlled environments to push the network to its theoretical limits without risking user funds or application logic. While this doesn’t reflect everyday user activity, it provides valuable insight into how Solana’s architecture handles extreme throughput scenarios.
To put this in context, Visa’s payment network is often cited as a gold standard for global transaction processing, with an average capacity of roughly 4,000 TPS and peaks up to 65,000 TPS during holiday surges. Solana’s demonstration of over 100,000 TPS not only eclipses these figures but also positions it as the fastest major blockchain by a significant margin in 2025 (source).
Visualizing Solana Network Performance Under Pressure
During the stress test, block explorers and analytics platforms like Solana Compass lit up with activity. The average compute units consumed per block soared as validators processed an unprecedented volume of noop calls. These visuals tell a compelling story: rather than buckling under pressure, the network maintained stability and low latency throughout the surge.
Key visual cues included:
- Block times held steady near their target interval
- No significant rise in failed transactions or orphaned blocks
- Validator participation remained high despite elevated loads
This resilience can be attributed to recent upgrades in validator software, most notably the Agave client, which distributed workloads more efficiently among nodes.
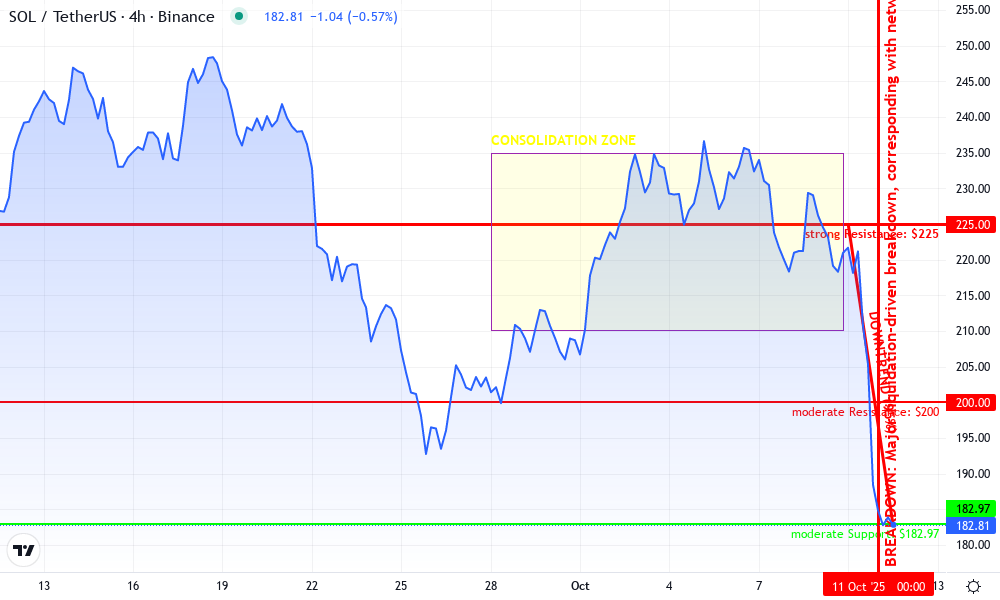
Solana Technical Analysis Chart
Analysis by Mina Parkhurst | Symbol: BINANCE:SOLUSDT | Interval: 4h | Drawings: 7
Technical Analysis Summary
Draw a sharp downtrend line connecting the recent highs near $225 (Oct 10, 2025) to the current price at $182.97 (Oct 11, 2025). Mark the abrupt breakdown with a vertical line at the date of the liquidation event (Oct 11, 2025). Highlight the previous consolidation range between $210 and $235 with a rectangle. Add horizontal lines at key support ($183, $153) and resistance ($200, $225) levels. Use callouts to annotate the breakdown event and potential bounce zone near $183.
Risk Assessment: medium
Analysis: While the sharp selloff may offer short-term bounce opportunities, the overall trend is now bearish until proven otherwise. Strong fundamental backdrop, but technical damage is significant.
Mina Parkhurst’s Recommendation: Wait for stabilization or a clear reversal pattern before committing to new positions. For aggressive traders, a nimble bounce play near $183 is possible, but risk management is crucial. My approach is to remain patient and let the market confirm a bottom before scaling in.
Key Support & Resistance Levels
📈 Support Levels:
- $182.97 – Current market support, potential bounce zone after sharp liquidation drop. moderate
- $152.85 – 24h low and potential next support if current level fails. strong
📉 Resistance Levels:
- $200 – Psychological and historical resistance from previous breakdown. moderate
- $225 – Major resistance; recent swing high before breakdown. strong
Trading Zones (medium risk tolerance)
🎯 Entry Zones:
- $183 – Potential mean reversion or technical bounce after liquidation event; only for nimble traders.high risk
- $153 – Stronger support, potential accumulation zone if further downside occurs.medium risk
🚪 Exit Zones:
- $200 – First logical profit target on a bounce; aligns with prior support turned resistance.💰 profit target
- $225 – Major resistance and pre-breakdown liquidity zone.💰 profit target
- $175 – Stop loss just below current support in case of further breakdown.🛡️ stop loss
Technical Indicators Analysis
📊 Volume Analysis:
Pattern: Not visible in chart, but likely spiked during liquidation.
Volume likely surged during the liquidation event. Look for confirmation of capitulation or reversal on volume in next sessions.
📈 MACD Analysis:
Signal: Likely bearish crossover or deep oversold conditions given sharp decline.
MACD would likely show strong bearish momentum, but watch for any bullish divergence as price stabilizes.
Applied TradingView Drawing Utilities
This chart analysis utilizes the following professional drawing tools:
Disclaimer: This technical analysis by Mina Parkhurst is for educational purposes only and should not be considered as financial advice.
Trading involves risk, and you should always do your own research before making investment decisions.
Past performance does not guarantee future results. The analysis reflects the author’s personal methodology and risk tolerance (medium).
The Gap Between Theoretical and Real-World Throughput
It’s important to distinguish between theoretical maximums and practical realities. While Solana hit over 100k TPS under synthetic load conditions, real-world throughput averages around 3,500 TPS, of which roughly two-thirds are validator vote transactions essential for consensus. This leaves effective user-facing capacity (payments and dApp interactions) closer to 1,000 TPS, which is still far ahead of most competing blockchains (source).
The gap can be illustrated visually:
Solana Network TPS Performance Comparison (2025 Stress Test)
| Metric | Transactions Per Second (TPS) | Description |
|---|---|---|
| Peak TPS | 107,540 | Maximum throughput achieved during stress test with ‘noop’ program calls |
| Average Network TPS | 3,500 | Typical throughput including validator vote transactions |
| Effective User-Facing TPS | ~1,000 | Estimated real-world throughput for payments and applications |
This distinction matters for developers building games or DeFi protocols on Solana, while headline numbers are impressive for marketing and institutional adoption (with inflows surpassing $1 billion in 2025), it’s the sustained real-world performance that will drive user satisfaction and long-term ecosystem growth.
Solana (SOL) Price Prediction 2026-2031
Based on recent network milestones, institutional inflows, and evolving market/regulatory trends
| Year | Minimum Price | Average Price | Maximum Price | Year-over-Year Change (Avg) | Market Scenario Insight |
|---|---|---|---|---|---|
| 2026 | $145.00 | $210.00 | $325.00 | +14.6% | Post-100k TPS event adoption accelerates, but volatility remains with regulatory and macro headwinds. |
| 2027 | $170.00 | $260.00 | $390.00 | +23.8% | DeFi/NFT on Solana grows; possible ETF approvals boost institutional demand. Competition from new L1s intensifies. |
| 2028 | $200.00 | $325.00 | $480.00 | +25.0% | Wider mainstream adoption as scalability proves itself; major partnerships and further tech development. |
| 2029 | $240.00 | $390.00 | $600.00 | +20.0% | Solana cements itself as a top blockchain for high-throughput dApps. Regulatory clarity in US/EU aids growth. |
| 2030 | $285.00 | $465.00 | $720.00 | +19.2% | Mature ecosystem; high-value enterprise and retail use cases. Some market saturation, but steady inflows. |
| 2031 | $340.00 | $550.00 | $850.00 | +18.3% | Continued expansion in Web3, DePIN, and global payments. Macro cycles and competition create broader price range. |
Price Prediction Summary
Solana’s demonstrated throughput and institutional inflows position it strongly for the coming years. While 2026 may see some consolidation after rapid 2025 growth, ongoing adoption, developer activity, and regulatory progress are expected to drive steady price appreciation. The minimum-maximum ranges reflect both bullish scenarios (mainstream adoption, favorable regulation) and bearish risks (competition, macro shocks).
Key Factors Affecting Solana Price
- Sustained network performance and scalability (100k+ TPS milestone)
- Institutional inflows and possible ETF approvals
- Growth in DeFi, NFTs, and new use cases on Solana
- Regulatory clarity in major markets (e.g., SEC stance, ETF regulation)
- Competition from other high-TPS L1s (e.g., Aptos, Sui, Ethereum upgrades)
- Macro-economic factors and crypto market cycles
- Ecosystem and developer activity, including new partnerships and integrations
Disclaimer: Cryptocurrency price predictions are speculative and based on current market analysis.
Actual prices may vary significantly due to market volatility, regulatory changes, and other factors.
Always do your own research before making investment decisions.
The implications of these findings are far-reaching for the Solana ecosystem. Developers and users alike are now equipped with a clearer understanding of what the network can handle, both in best-case scenarios and in day-to-day operations. For instance, while a peak of 107,540 TPS demonstrates raw computational muscle, most decentralized applications (dApps) and games will be built around the more conservative figures of 1,000 to 3,500 TPS. This ensures that expectations remain grounded in operational reality rather than stress-test hype.
Fee Analysis and Cost Efficiency
One of Solana’s most compelling advantages is its ability to maintain ultra-low transaction fees, even under heavy load. During the October 11 event, average fees remained fractions of a cent, despite the network processing orders of magnitude more transactions than its competitors. This is especially relevant for high-frequency use cases like DeFi trading bots, NFT minting events, or on-chain gaming microtransactions.
Top 5 Use Cases Thriving on Solana’s High TPS
-
NFT Marketplaces such as Magic Eden leverage Solana’s speed and low costs to support high-volume minting, trading, and auctions without network congestion, making NFTs accessible to a broader audience.
-
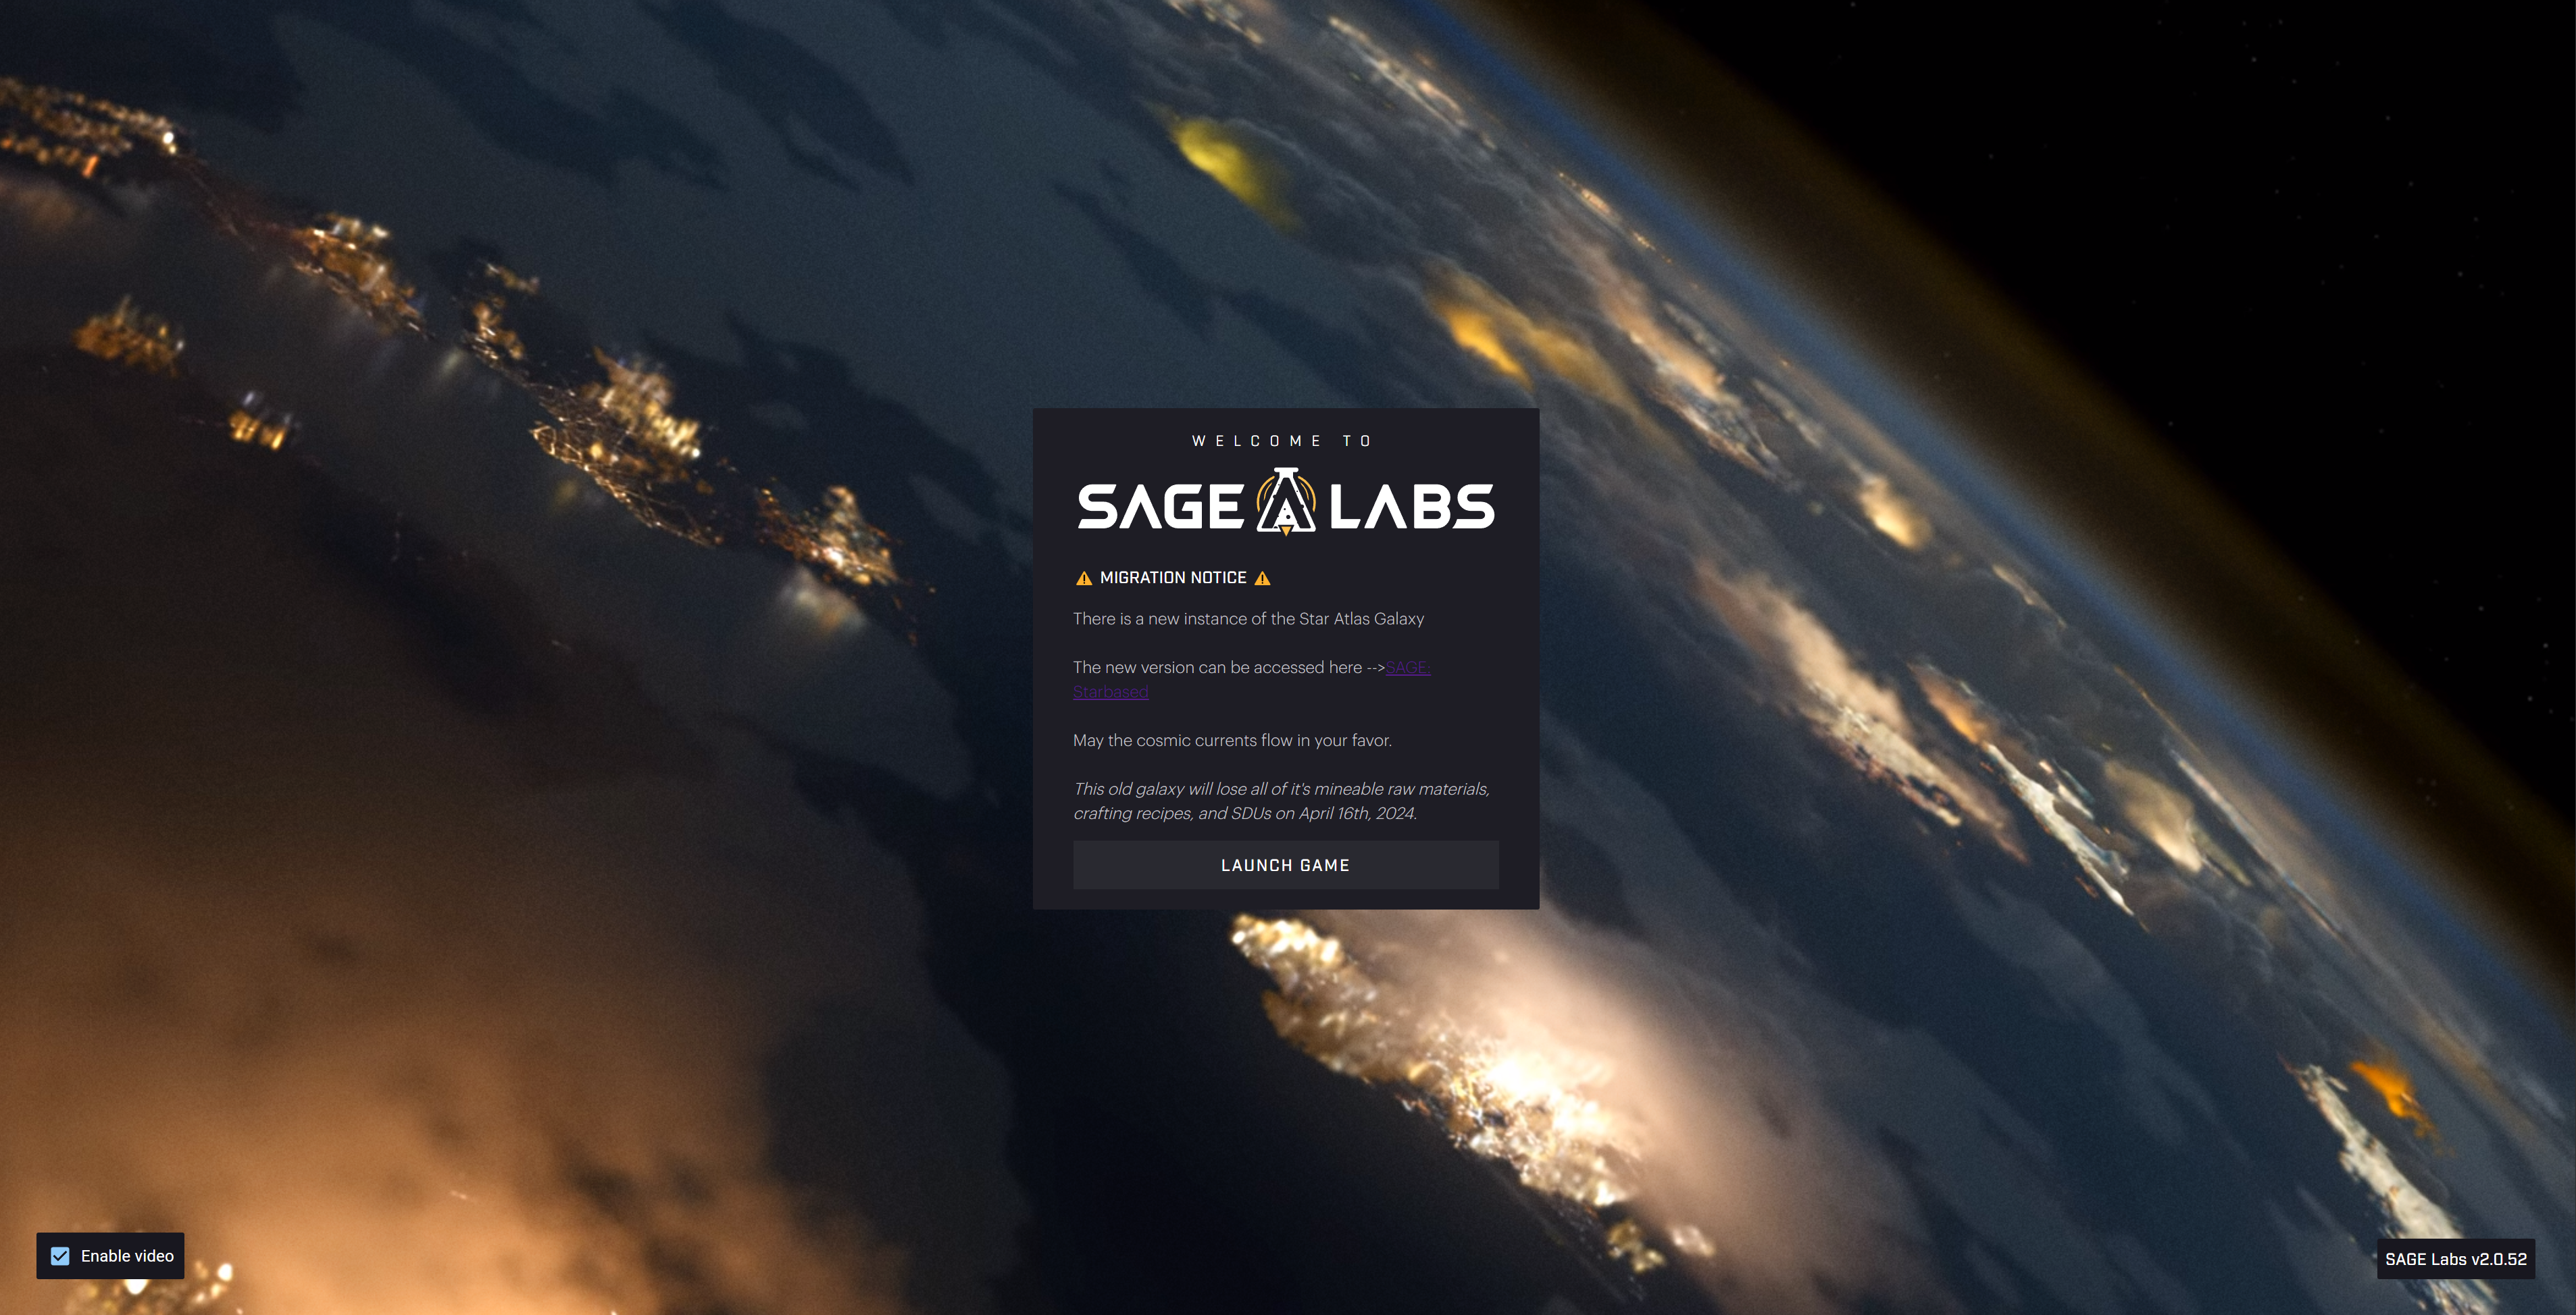
On-chain Gaming Platforms like Star Atlas and EV.io utilize Solana’s fast transaction finality for real-time gameplay, asset transfers, and microtransactions, delivering seamless blockchain gaming experiences.
-

Payments and Remittances through apps like Solana Pay take advantage of instant, low-fee settlements, making cross-border payments and merchant transactions efficient and cost-effective.
-
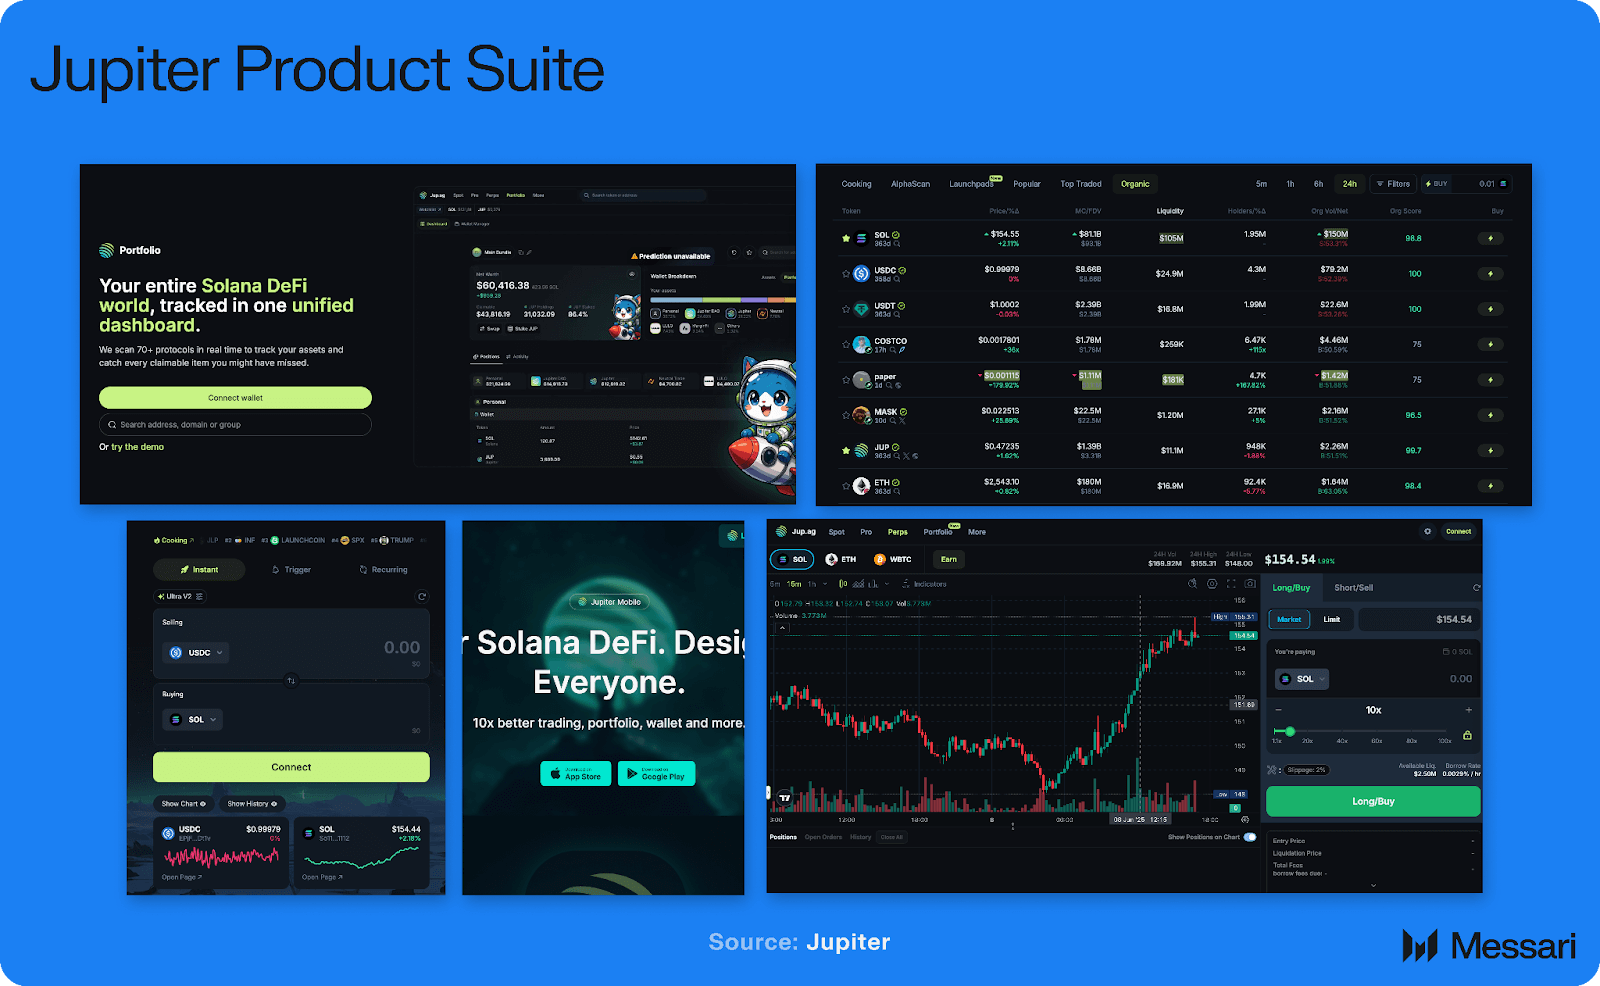
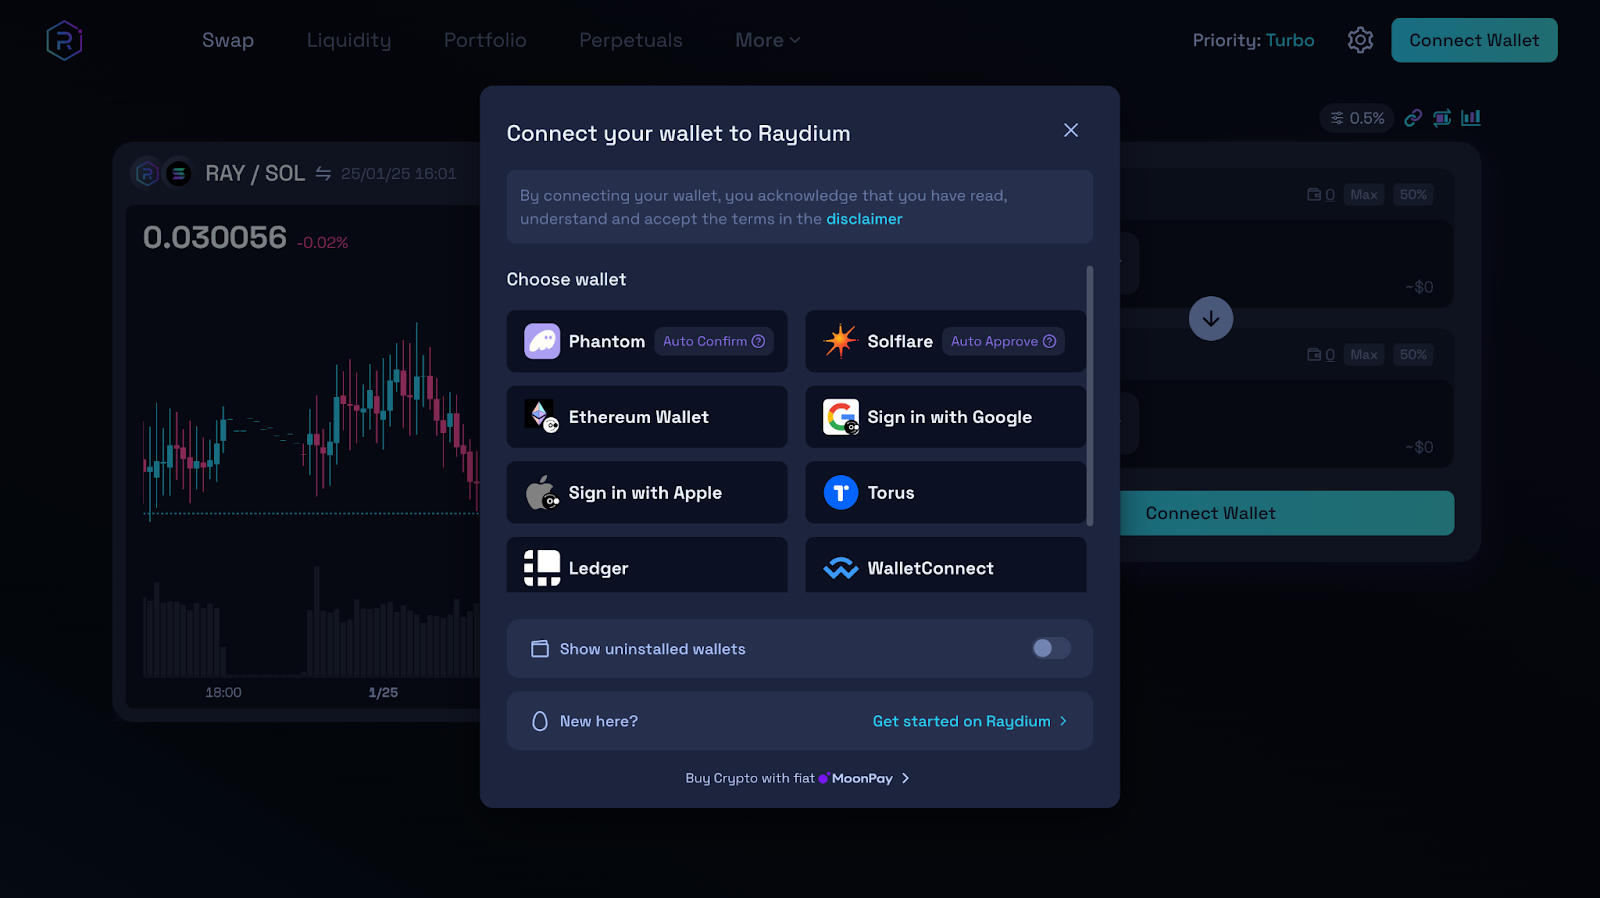
DeFi Protocols including Marinade Finance and Jupiter rely on Solana’s high TPS for fast swaps, yield farming, and liquid staking, ensuring users can access complex financial services without delays or high costs.
For users accustomed to Ethereum’s congestion-induced fee spikes, Solana’s stability offers a refreshing alternative. The predictability in both speed and cost is likely to attract more developers seeking scalable solutions for mass-market applications.
Institutional Confidence and Ecosystem Growth
The recent performance surge has not gone unnoticed by institutional players. With institutional inflows surpassing $1 billion in 2025, as reported by CoinMarketCap and Yahoo Finance, Solana is increasingly viewed as a credible backbone for next-generation financial products. Robust infrastructure upgrades, like the Agave validator client, have reinforced this perception by delivering both reliability and efficiency at scale.
This momentum is reflected in the growing diversity of projects launching on Solana: from high-speed DEXs to complex on-chain games that demand near-instant settlement times. The network’s ability to absorb massive transaction loads without compromising user experience cements its reputation as a leader among high-performance blockchains.

Community Insights: What Builders Are Saying
The developer community has responded with cautious optimism. Many acknowledge that while synthetic benchmarks are useful for stress testing, it’s sustained real-world throughput, and not just headline peaks, that will determine long-term success.
“Solana’s stress test shows what’s possible when you optimize every layer of the stack, but real adoption will come from consistent performance under diverse workloads. ”
Feedback from validators also highlights how recent upgrades have improved workload distribution and reduced bottlenecks, critical factors for future scalability as dApp adoption accelerates.
Do you trust Solana’s network stability after its 100,000 TPS milestone?
Solana recently hit a record 107,540 transactions per second (TPS) during a stress test, showcasing impressive scalability. However, real-world throughput for users remains much lower (around 1,000 TPS for payments and apps). Does this milestone boost your confidence in Solana’s network stability?
Looking Ahead: What’s Next for Solana Network Performance?
With SOL trading at $183.28, all eyes are on how well these performance gains translate into tangible ecosystem growth over the coming quarters. The roadmap includes further optimizations to validator software, enhanced tooling for developers, and continued focus on keeping transaction costs low even as usage scales up.
If you’re considering building or investing in the Solana ecosystem, it’s crucial to balance excitement over technical milestones with an understanding of current practical limits. Stay tuned to analytics dashboards like these live charts, follow validator updates closely, and engage with community feedback channels to stay ahead of emerging trends.