Solana’s memecoin scene has entered a new era, driven by the stealth and efficiency of Dark Automated Market Makers (Dark AMMs). These platforms are quietly reshaping how tokens are launched and traded, providing both privacy and speed at a time when network congestion and front-running have become serious concerns for retail and pro traders alike. With Binance-Peg SOL (SOL) trading at $166.20, the ecosystem is riding high on both price momentum and unprecedented developer activity.

Dark AMMs: The Engine Under Solana’s Memecoin Boom
Unlike traditional AMMs that broadcast every order on-chain, Dark AMMs obscure order flow, making it harder for bots to front-run trades or manipulate liquidity. This privacy layer is more than just a technical upgrade – it’s a structural shift in how value is discovered for new tokens, especially in the hyper-volatile world of memecoins. By hiding intentions until execution, Dark AMMs level the playing field for launchpad participants, giving everyday users a shot at fair entry prices.
The impact is visible across the leading Solana memecoin launchpads. Platforms like Moonshot have integrated Dark AMM technology to facilitate over 166,000 token launches by March 2025, generating $6.5 million in revenue according to cryptodamus.io. This rapid-fire deployment model – often dubbed the “Moonshot Meta” – thrives on Solana’s low fees and sub-second finality but would be unthinkable without the privacy guarantees of Dark AMMs.

The Data: Visualizing Solana’s Explosive Token Creation
Consider this: In May 2024 alone, nearly half a million tokens were minted on Solana – outpacing even Ethereum’s legendary bull cycle numbers (source). The chart above illustrates this parabolic growth curve. Each spike correlates with improvements in launchpad UX and deeper integration of Dark AMM rails, allowing anyone with an idea (or just good meme timing) to spin up a token with minimal friction.
This democratization isn’t just about volume; it’s about velocity and inclusivity. Tools like Pump. fun have made token creation accessible even to non-coders (NFT Evening). But it’s the underlying liquidity infrastructure – invisible yet critical – that determines whether these tokens can actually trade beyond their initial hype window.
Solana Market Structure 2025: Privacy Meets Performance
The rise of Dark AMMs has also forced legacy players like Raydium to innovate or risk irrelevance. After initial hesitance, Raydium launched its own memecoin launchpad in response to Pump. fun’s runaway success (Blockworks). This competitive pressure has led to better fee structures, improved graduation rates for new tokens, and more robust anti-bot measures across the board.
For traders watching SOL at $166.20, these developments aren’t just noise; they’re signals that Solana DeFi is evolving toward greater sophistication. Liquidity depth is improving as more capital flows into dark pools where alpha isn’t instantly arbitraged away by bots. The result? A marketplace where volatility becomes opportunity rather than pure risk.
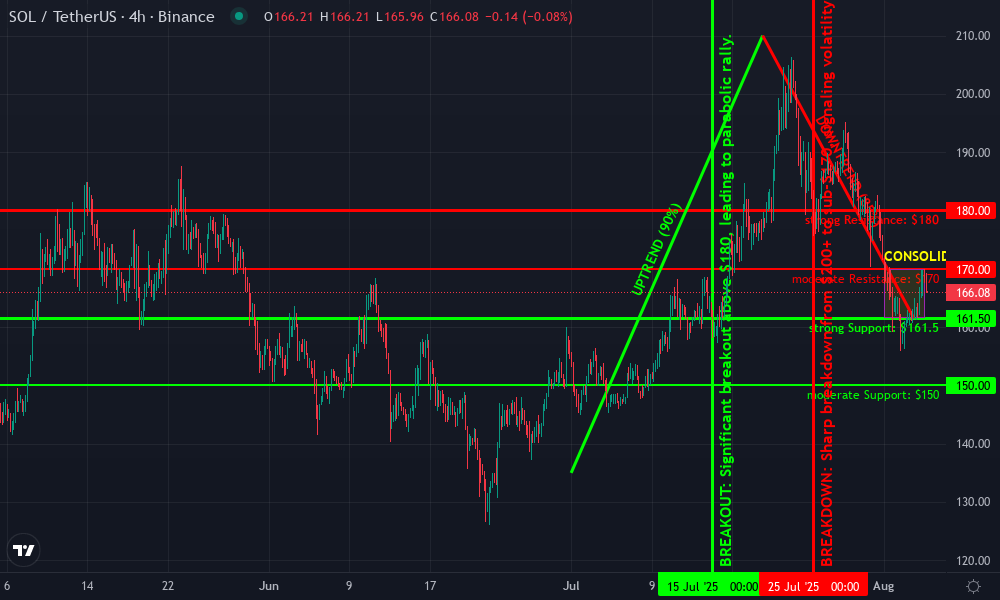
Solana Technical Analysis Chart
Analysis by Jacob Pendleton | Symbol: BINANCE:SOLUSDT | Interval: 4h | Drawings: 7
Technical Analysis Summary
On this 4H chart for SOL/USDT (Binance), start by plotting a primary uptrend line from the July swing low near $130.00 to the July high at ~$205.00. Draw a secondary downtrend line from the recent peak (above $205.00) to the current price region. Mark horizontal support at $161.50 (recent swing low) and $150.00 (major base in July), and resistance at $170.00 (minor supply) and $180.00 (previous support now resistance). Highlight the recent range between $161.50 and $170.00 for possible accumulation. Annotate with rectangles to illustrate the consolidation in late June and draw arrows for the breakout and breakdown events. Use long/short position tools to visually define possible risk/reward zones at support/resistance.
Solana vs. Ethereum and Raydium: 6-Month Price Performance Comparison
YTD performance of Solana (SOL), Ethereum (ETH), and Raydium (RAY) based on real-time market data as of 2025-08-05.
| Asset | Current Price | 6 Months Ago | Price Change |
|---|---|---|---|
| Solana (SOL) | $166.16 | $130.93 | +26.9% |
| Ethereum (ETH) | $3,613.43 | $2,275.61 | +58.8% |
| Raydium (RAY) | $2.64 | $2.64 | +0.0% |
Analysis Summary
Over the past six months, Ethereum (ETH) has outperformed both Solana (SOL) and Raydium (RAY), with a 58.8% price increase. Solana posted a solid 26.9% gain, while Raydium’s price remained flat over the same period.
Key Insights
- Ethereum (ETH) led the group with a +58.8% price increase over six months.
- Solana (SOL) achieved a notable +26.9% gain, reflecting strong network activity and memecoin launch momentum.
- Raydium (RAY) showed no price change, indicating stability despite increased ecosystem activity.
- The data highlights Solana’s robust growth but also shows that Ethereum outpaced it in terms of price appreciation YTD.
This comparison uses exact real-time and historical price data for SOL, ETH, and RAY as provided above, ensuring accuracy by referencing only the specified data sources and timeframes.
Data Sources:
- Main Asset: https://cryptoinvestp.com/market/
- Ethereum: https://cryptoinvestp.com/market/
- Bitcoin: https://cryptoinvestp.com/market/
- Raydium: https://cryptoinvestp.com/market/
- Binance Coin: https://cryptoinvestp.com/market/
- Cardano: https://cryptoinvestp.com/market/
- Avalanche: https://cryptoinvestp.com/market/
- Polygon: https://cryptoinvestp.com/market/
Disclaimer: Cryptocurrency prices are highly volatile and subject to market fluctuations. The data presented is for informational purposes only and should not be considered as investment advice. Always do your own research before making investment decisions.
Solana’s memecoin scene has entered a new era, driven by the stealth and efficiency of Dark Automated Market Makers (Dark AMMs). These platforms are quietly reshaping how tokens are launched and traded, providing both privacy and speed at a time when network congestion and front-running have become serious concerns for retail and pro traders alike. With Binance-Peg SOL (SOL) trading at $166.20, the ecosystem is riding high on both price momentum and unprecedented developer activity.
Dark AMMs: The Engine Under Solana’s Memecoin Boom
Unlike traditional AMMs that broadcast every order on-chain, Dark AMMs obscure order flow, making it harder for bots to front-run trades or manipulate liquidity. This privacy layer is more than just a technical upgrade – it’s a structural shift in how value is discovered for new tokens, especially in the hyper-volatile world of memecoins. By hiding intentions until execution, Dark AMMs level the playing field for launchpad participants, giving everyday users a shot at fair entry prices.
The impact is visible across the leading Solana memecoin launchpads. Platforms like Moonshot have integrated Dark AMM technology to facilitate over 166,000 token launches by March 2025, generating $6.5 million in revenue according to cryptodamus.io. This rapid-fire deployment model – often dubbed the “Moonshot Meta” – thrives on Solana’s low fees and sub-second finality but would be unthinkable without the privacy guarantees of Dark AMMs.
The Data: Visualizing Solana’s Explosive Token Creation
Consider this: In May 2024 alone, nearly half a million tokens were minted on Solana – outpacing even Ethereum’s legendary bull cycle numbers (source). The chart above illustrates this parabolic growth curve. Each spike correlates with improvements in launchpad UX and deeper integration of Dark AMM rails, allowing anyone with an idea (or just good meme timing) to spin up a token with minimal friction.
This democratization isn’t just about volume; it’s about velocity and inclusivity. Tools like Pump. fun have made token creation accessible even to non-coders (NFT Evening). But it’s the underlying liquidity infrastructure – invisible yet critical – that determines whether these tokens can actually trade beyond their initial hype window.
Solana Market Structure 2025: Privacy Meets Performance
The rise of Dark AMMs has also forced legacy players like Raydium to innovate or risk irrelevance. After initial hesitance, Raydium launched its own memecoin launchpad in response to Pump. fun’s runaway success (Blockworks). This competitive pressure has led to better fee structures, improved graduation rates for new tokens, and more robust anti-bot measures across the board.
For traders watching SOL at $166.20, these developments aren’t just noise; they’re signals that Solana DeFi is evolving toward greater sophistication. Liquidity depth is improving as more capital flows into dark pools where alpha isn’t instantly arbitraged away by bots. The result? A marketplace where volatility becomes opportunity rather than pure risk.
Solana Technical Analysis Chart
Analysis by Jacob Pendleton | Symbol: BINANCE:SOLUSDT | Interval: 4h | Drawings: 9
Technical Analysis Summary
Start by marking a horizontal support at $161.50, as price recently bounced from this level. Draw a horizontal resistance at $170.00, where price action struggled to break higher after the latest down move. Use a trend line to capture the sharp uptrend from early July (around $135) to the mid-July high (over $200), then another trend line for the corrective move down to $161.50. Highlight the recent consolidation between $161.50 and $170.00 with a rectangle. Mark potential entry just above $170.00 (breakout), and stop-loss just below $161.50 (breakdown). Use a vertical line and callout for the July breakout above $180.00 as a special event. Annotate MACD and volume zones if available, but focus on price structure.
Risk Assessment:medium
374151;margin-bottom: 751em;”>Analysis: Volatility remains elevated due to memecoin speculation and Dark AMM flows. Key levels are well defined, but failure to reclaim $170 increases downside risk. Opportunities exist for both breakout and range trading, but size positions accordingly.
Jacob Pendleton’s Recommendation: Wait for confirmation above $170 for new longs. Alternatively, use tight stops for range trades at support. Prioritize risk management volatility is opportunity, but only for the prepared.
Key Support & Resistance Levels
📈 Support Levels:
- $161 .�5 – Recent swing low and bounce zone. Key level for bulls to defend.strong
- $150 – Secondary support previous congestion area in June/July.moderate
📉 Resistance Levels:
- $170 – Immediate resistance,
capping current bounce attempts.moderate - $180 – Post-breakdown level and former support now likely resistance.strong
Trading Zones (medium risk tolerance)
🎯 Entry Zones:
- $170\.50 – Breakout above consolidation,
confirmation of renewed bullish momentum.medium risk - $161\.80 – Aggressive bounce play off strong support;tight stop required.high risk
Solana (SOL) Price Prediction 2026-2031
Forecasting SOL Price Scenarios Amidst Dark AMM-Driven Memecoin Boom and Network Growth
| Year | Minimum Price | Average Price | Maximum Price | Y/Y % Change (Avg) | Market Scenario Insights |
|---|---|---|---|---|---|
| 2026 | $120.00 | $185.00 | $260.00 | +11% | Continued memecoin activity, but increased volatility; regulatory scrutiny intensifies, leading to occasional drawdowns. |
| 2027 | $135.00 | $210.00 | $295.00 | +13.5% | Wider institutional adoption and improved DeFi protocols; Solana’s tech upgrades enhance scalability, boosting sentiment. |
| 2028 | $155.00 | $245.00 | $345.00 | +16.7% | Bullish market cycle accelerates, with new use cases in gaming and tokenization; fierce competition from other L1s tempers upside. |
| 2029 | $175.00 | $275.00 | $390.00 | +12.2% | Memecoin trend matures, but Dark AMMs drive privacy-focused DeFi; periodic corrections as market consolidates. |
| 2030 | $160.00 | $320.00 | $440.00 | +16.4% | Major regulatory clarity unlocks new capital inflows; Solana cements its place as a top-3 blockchain. |
| 2031 | $180.00 | $370.00 | $520.00 | +15.6% | Next generation DApps and mainstream adoption; SOL benefits from high throughput and ecosystem stickiness. |
Price Prediction Summary
Solana’s price outlook through 2031 is characterized by steady growth, underpinned by its pivotal role in the memecoin and DeFi sectors, especially as Dark AMMs fuel network activity. While short-term volatility and regulatory risks remain, long-term prospects are strong given ongoing innovation, expanding use cases, and potential for wider adoption. Investors should expect both sharp rallies and deep corrections as the market matures.
Key Factors Affecting Solana Price
- Dark AMMs enabling rapid memecoin launches and increased network activity.
- Regulatory developments, especially regarding privacy and token launches.
- Continued technical improvements and scalability upgrades on Solana.
- Competition from other high-performance blockchains (e.g., Ethereum L2s, new L1s).
- Shifts in market sentiment around DeFi, NFTs, and real-world asset tokenization.
- Potential for mainstream adoption via new DApps, gaming, and financial products.
Disclaimer: Cryptocurrency price predictions are speculative and based on current market analysis.
Actual prices may vary significantly due to market volatility, regulatory changes, and other factors.
Always do your own research before making investment decisions.
Solana vs Ethereum and Raydium: 6-Month Price Performance Comparison
Comparing the 6-month price performance of Solana (SOL), Ethereum (ETH), and Raydium (RAY) as of August 5, 2025, based on real-time market data.
| Asset | Current Price | 6 Months Ago | Price Change |
|---|---|---|---|
| Solana (SOL) | $166.16 | $185.95 | -10.7% |
| Ethereum (ETH) | $3,613.43 | $2,450.07 | +47.5% |
| Raydium (RAY) | $2.64 | $2.64 | +0.0% |
Analysis Summary
Over the past 6 months, Ethereum (ETH) has significantly outperformed both Solana (SOL) and Raydium (RAY), with a 47.5% price increase. Solana experienced a decline of 10.7%, while Raydium’s price remained unchanged. This highlights a divergence in performance among major Solana ecosystem assets and Ethereum during a period of heightened memecoin activity and innovation on Solana.
Key Insights
- Ethereum (ETH) led the comparison with a strong 47.5% gain over 6 months.
- Solana (SOL) declined by 10.7%, despite increased network activity and memecoin launches.
- Raydium (RAY), a key Solana DEX and memecoin launchpad, saw no net price change over the period.
- The data suggests that while Solana’s ecosystem is rapidly evolving, this has not yet translated into price appreciation for SOL or RAY in the last 6 months.
All prices and percentage changes are sourced directly from the provided real-time market data as of August 5, 2025. The comparison uses exact figures for current and 6-month historical prices, ensuring accuracy and consistency with the supplied data.
Data Sources:
- Main Asset: https://www.coingecko.com/en
- Ethereum: https://cryptsy.com/price-analysis-10-25-btc-eth-bnb-sol-xrp-doge-ton-ada-avax-shib/
- Bitcoin: https://cryptsy.com/price-analysis-10-25-btc-eth-bnb-sol-xrp-doge-ton-ada-avax-shib/
- Raydium: https://www.coingecko.com/en
- Binance Coin: https://cryptsy.com/price-analysis-10-25-btc-eth-bnb-sol-xrp-doge-ton-ada-avax-shib/
- Avalanche: https://cryptsy.com/price-analysis-10-25-btc-eth-bnb-sol-xrp-doge-ton-ada-avax-shib/
- Polygon: https://www.coingecko.com/en
- Cardano: https://cryptsy.com/price-analysis-10-25-btc-eth-bnb-sol-xrp-doge-ton-ada-avax-shib/
Disclaimer: Cryptocurrency prices are highly volatile and subject to market fluctuations. The data presented is for informational purposes only and should not be considered as investment advice. Always do your own research before making investment decisions.
Key Benefits of Dark AMMs for Solana Memecoin Traders
-
Enhanced Privacy and Reduced Front-Running: Dark AMMs on Solana, such as those integrated with Moonshot, conceal order book details, minimizing the risk of front-running and enabling traders to execute strategies without exposing their intentions.
-

Rapid and Efficient Token Launches: Platforms like Moonshot leverage Dark AMMs to facilitate the instant creation and trading of memecoins, supporting over 166,000 tokens launched and generating $6.5 million in revenue by March 2025.
-
Lower Transaction Fees: Solana’s low-fee environment, combined with Dark AMM efficiency, allows traders to launch and swap memecoins with minimal costs, maximizing potential returns on small-cap tokens.
-
High Transaction Speeds: The integration of Dark AMMs with Solana’s high-performance blockchain ensures near-instant trade execution, crucial for capitalizing on fast-moving memecoin trends.
-
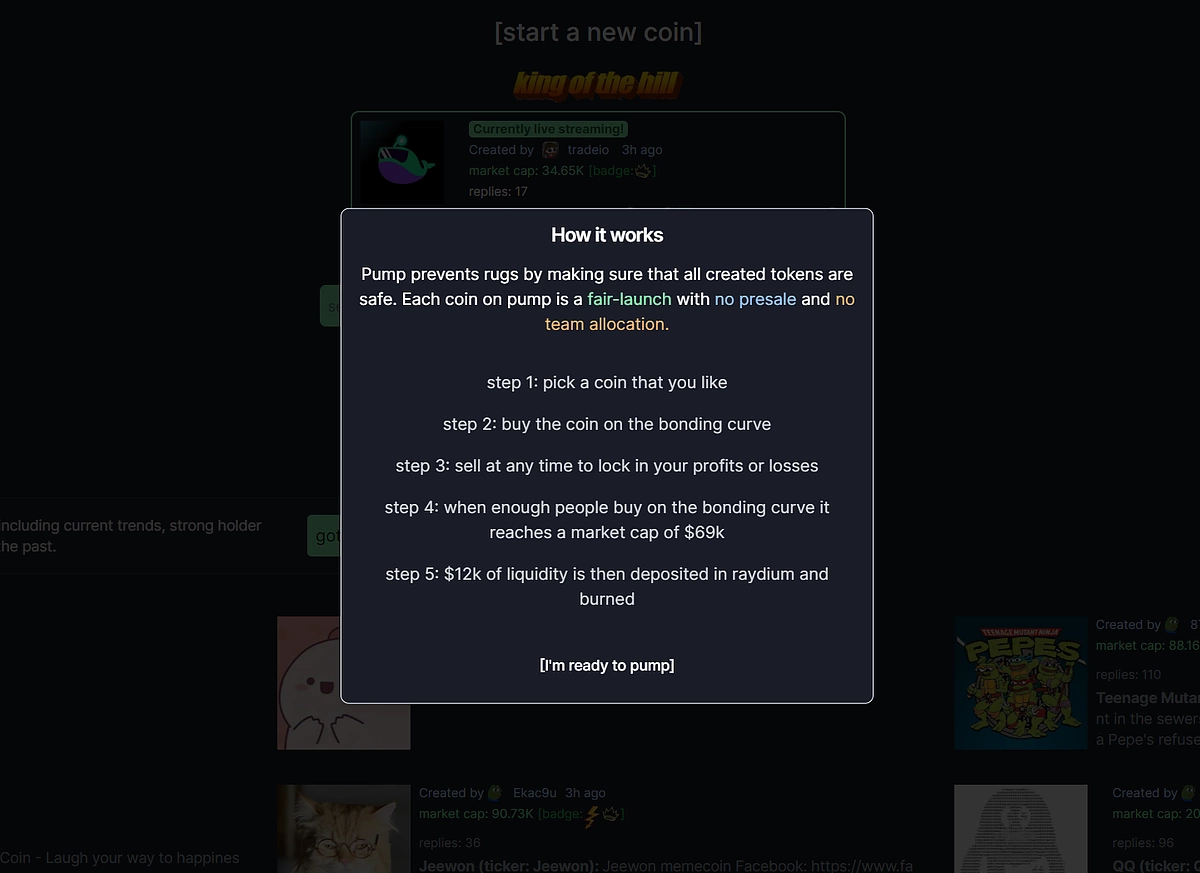
Democratized Access to Trading: User-friendly platforms like Pump.fun and Moonshot utilize Dark AMMs to lower technical barriers, enabling anyone to create, launch, and trade memecoins without coding expertise.
-
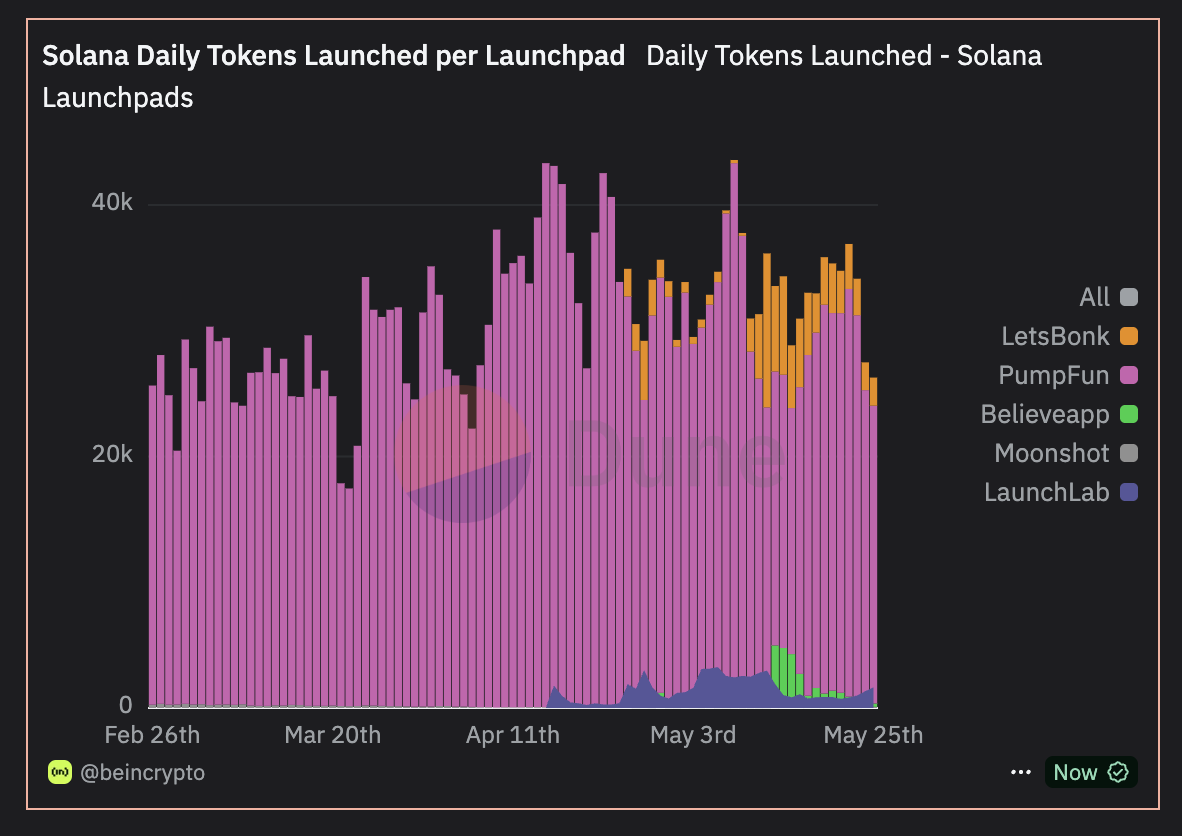
Boosted Network Activity and Ecosystem Growth: The proliferation of Dark AMMs has led to a surge in new token launches—almost half a million in May 2024—positioning Solana as a leading hub for memecoin innovation.