
Solana’s story in 2025 is being rewritten in real time as the possibility of a Solana ETF moves from speculation to tangible probability. With $SOL trading at $233.83 as of October 6,2025, and major asset managers like VanEck and 21Shares actively pursuing SEC approval for Solana ETFs, the market is bracing for a paradigm shift. The SEC’s recent move to streamline crypto ETF approvals to a 75-day window only adds fuel to the fire, making Solana one of the most watched assets in digital finance.
Solana ETFs: The Institutional On-Ramp
The significance of a Solana ETF cannot be overstated. For years, institutional investors have faced friction accessing crypto markets due to regulatory uncertainty, custody challenges, and liquidity constraints. An ETF structure solves these pain points by offering compliant exposure and deepening market liquidity. The Canadian approval of a Solana ETF for April 2025 was just the opening act; all eyes are now on U. S. regulators as they weigh applications from heavyweights like VanEck.
This institutional on-ramp could fundamentally change the supply-demand equation for SOL. As ETFs launch, they often require significant spot asset purchases to back shares - creating persistent buy pressure that can propel prices far beyond their pre-ETF norms. It’s no wonder that analysts across the board are revising their $SOL price prediction 2025 scenarios upward.
"Crypto ETFs are not just about access - they’re about legitimacy and scale. Solana’s speed and developer ecosystem make it uniquely positioned if institutions come knocking. "
$233.83: A New Baseline for Solana?
The current $SOL price of $233.83 marks a sharp recovery from recent volatility, with whale outflows giving way to renewed optimism on ETF news (Forbes Advisors' Estimate). This price level is more than just a number - it represents growing consensus that Solana is maturing into an institutional-grade asset.
If we look at recent forecasts:
- VanEck: Predicts SOL could reach $520 by end of 2025 if demand accelerates (VanEck's Projection)
- Forbes Advisors: Sees potential for $750 with broad-based DeFi adoption
- CoinCodex: Algorithmic models suggest an average price of $351.33 if bullish momentum holds
This spectrum reflects both exuberance and caution - but all roads lead higher from today’s baseline if ETF approval comes through.
Solana (SOL) Price Prediction Table: 2026-2031
Comprehensive Analyst Forecasts Based on ETF Momentum, Market Cycles, and Adoption Scenarios
| Year | Minimum Price | Average Price | Maximum Price | Year-over-Year % Change (Avg) | Key Market Scenario |
|---|---|---|---|---|---|
| 2026 | $210 | $320 | $790 | +37% | ETF-driven institutional inflows; potential for volatility as ETF market matures |
| 2027 | $185 | $370 | $950 | +16% | Increased DeFi adoption, Layer-1 competition rises; regulatory environment stabilizes |
| 2028 | $230 | $445 | $1,200 | +20% | Solana scales with new tech upgrades; DeFi and NFT use cases expand |
| 2029 | $270 | $525 | $1,500 | +18% | Broader Web3 integration, mainstream finance partnerships; global crypto adoption |
| 2030 | $320 | $610 | $1,800 | +16% | Sustained institutional demand; Solana ecosystem matures, but macro risks remain |
| 2031 | $285 | $675 | $2,050 | +11% | Market consolidation, Solana maintains top-tier status, but faces stiff competition |
Price Prediction Summary
Solana's price outlook from 2026 to 2031 is largely bullish, with average prices projected to rise from $320 in 2026 to $675 by 2031. ETF launches and growing institutional interest are likely to drive significant price appreciation, especially in the mid-to-late 2020s. However, the broad price ranges reflect potential volatility due to regulatory shifts, technology upgrades, and competition from other Layer-1 blockchains. Investors should expect both substantial upside and market corrections as the ecosystem evolves.
Key Factors Affecting Solana Price
- ETF approvals and institutional inflows: ETF launches can dramatically boost liquidity and price, but delays or denials could dampen momentum.
- Regulatory clarity: Favorable regulation could unlock institutional capital, while restrictive policies may constrain growth.
- Technological advancements: Upgrades to Solana's scalability, security, and functionality will be critical for sustained adoption.
- Market cycles: Crypto markets are prone to boom-bust cycles, affecting short-term price swings.
- Ecosystem and use case growth: Expansion of DeFi, NFTs, and enterprise adoption will support higher valuations.
- Competition: Rival Layer-1s (Ethereum, Avalanche, etc.) may impact Solana’s market share and price trajectory.
Disclaimer: Cryptocurrency price predictions are speculative and based on current market analysis. Actual prices may vary significantly due to market volatility, regulatory changes, and other factors. Always do your own research before making investment decisions.
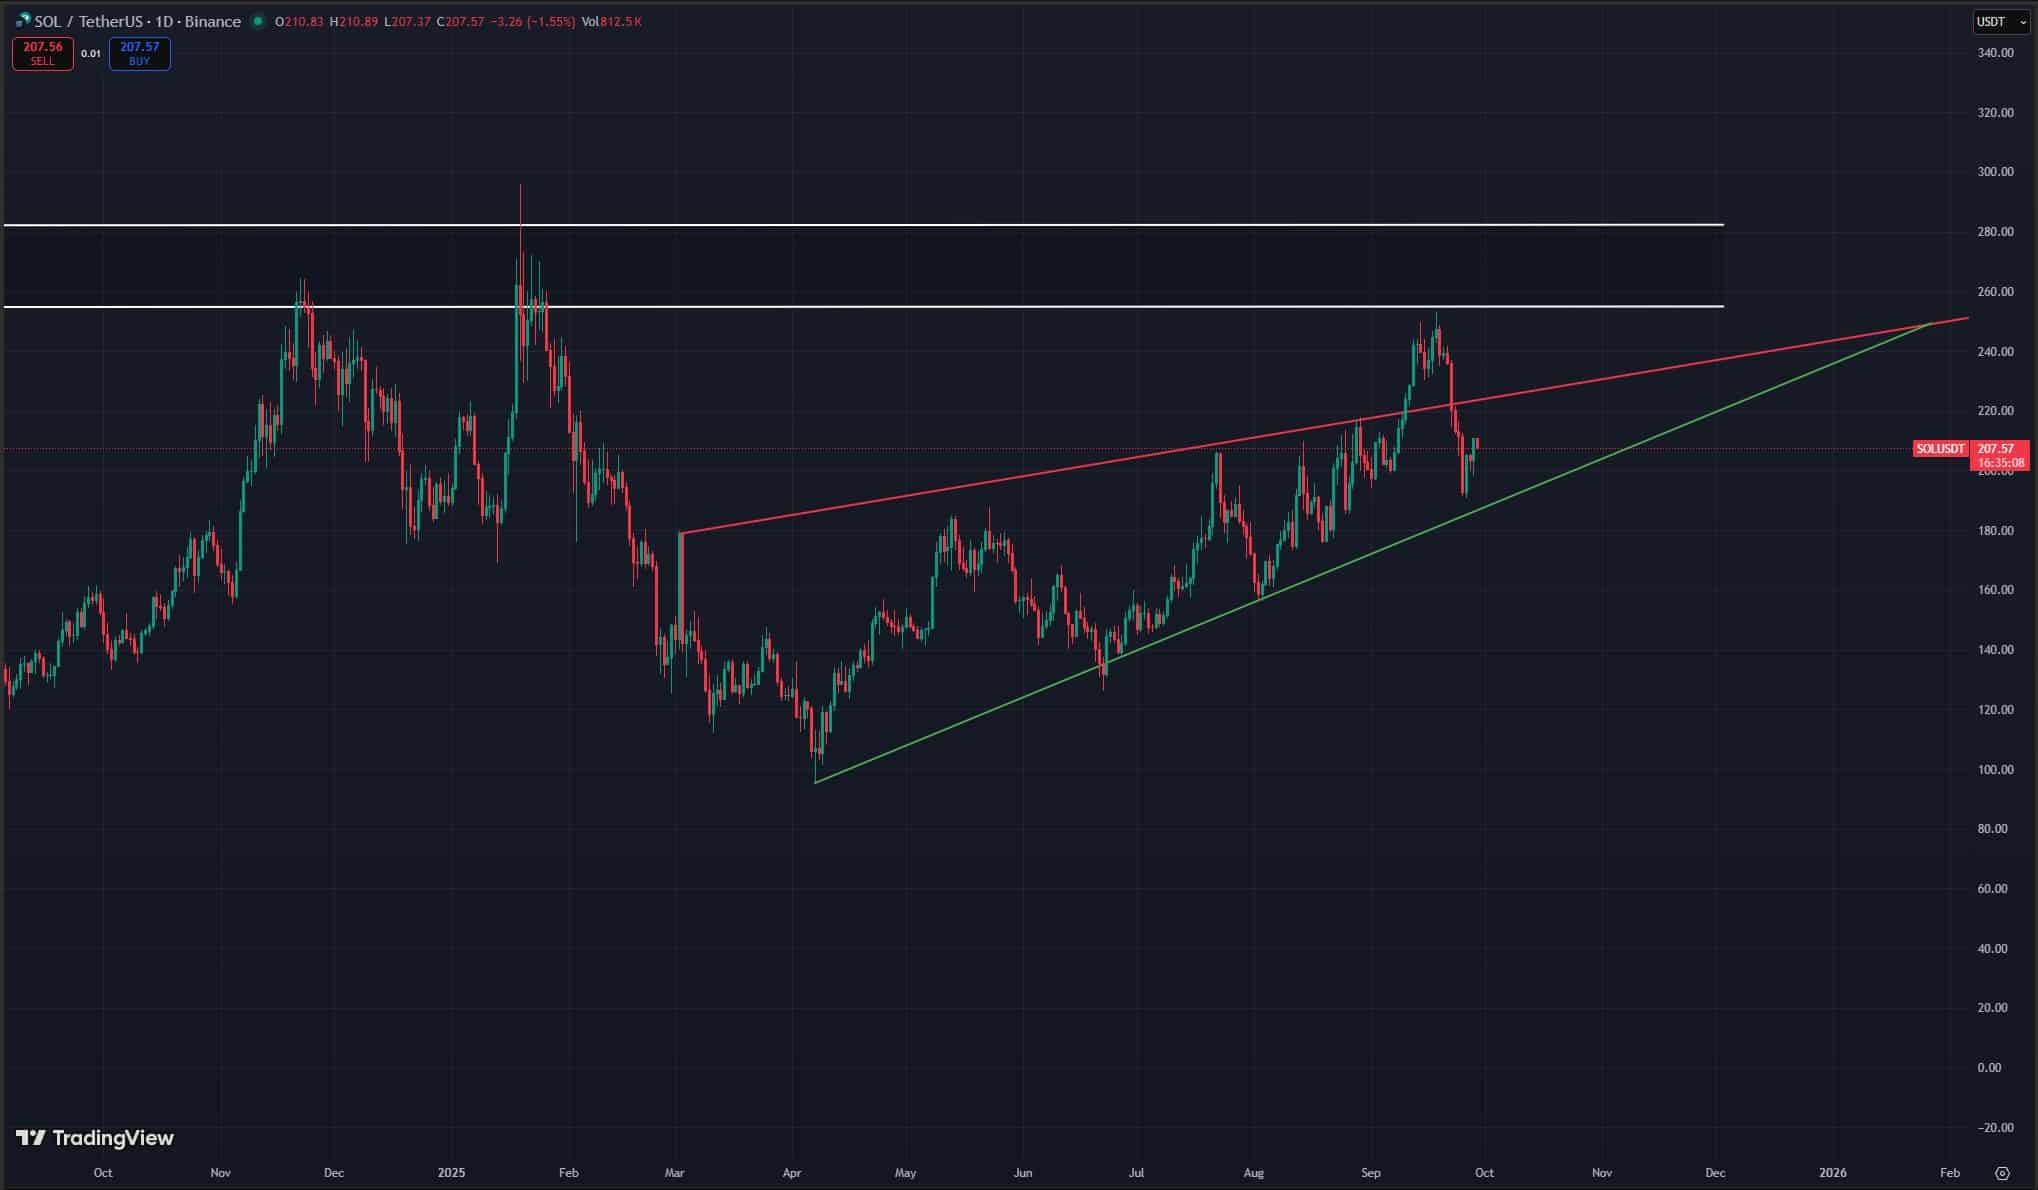
The Visuals: Charting Solana’s Trajectory Through 2025
No analysis is complete without seeing how these dynamics play out visually. Technical indicators show SOL consolidating above key support zones after its rebound to $233.83, with increasing volume hinting at accumulation rather than distribution.
Solana Technical Analysis Chart
Analysis by Jacob Pendleton | Symbol: BINANCE:SOLUSDT | Interval: 4h | Drawings: 7
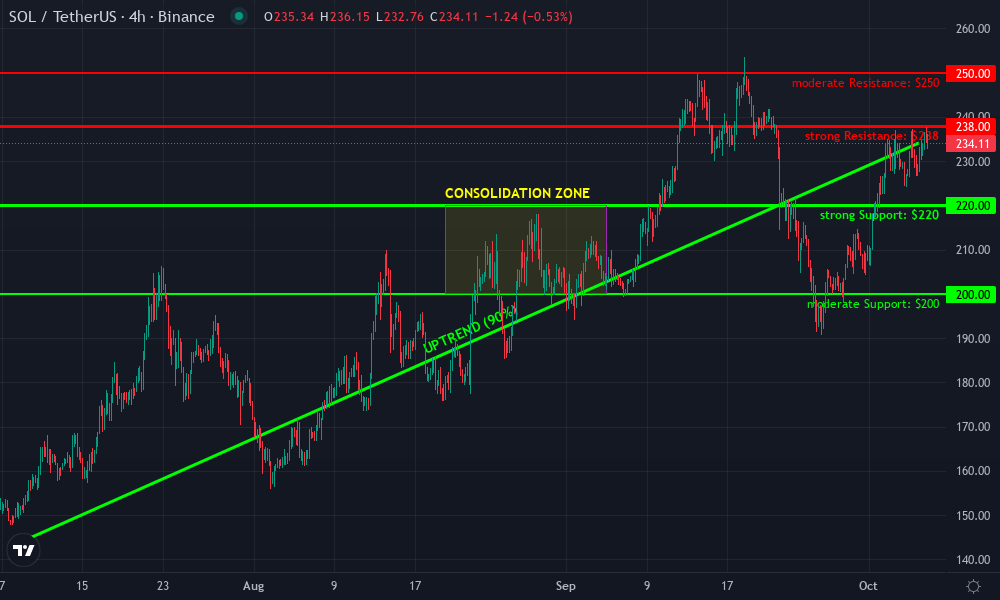
Technical Analysis Summary
Draw an ascending primary trend line connecting the July and August lows to the early October higher lows, showing the broader uptrend. Add horizontal resistance around $238 and $250, which have acted as local tops. Mark major support at $227 and $210. Highlight the consolidation zone from late September through early October between $227 and $238. Place a rectangle over this range. For volume and MACD, add callouts for recent increases in buying interest and any MACD bullish crossovers on the 4H timeframe. Use arrow markers to indicate breakout attempts and a vertical line for the likely ETF-related news event date.
Risk Assessment : medium
Analysis: While the trend is solidly bullish and institutional flows are likely, headline risk from ETF approval/disapproval is significant.Range trading is viable, but sudden volatility should be hedged.
Jacob Pendleton's Recommendation: Trade the consolidation range but be ready for volatility expansion.Options overlays or calculated stop losses are recommended.If ETF news hits, be prepared to scale into momentum trades or hedge quickly.Volatility is opportunity—manage risk, and don’t be complacent at resistance.
Key Support & Resistance Levels
📈 Support Levels:
- $227 - Recent swing low and base of current consolidation range.moderate
- $210 - Major support, previous reversal zone after last sharp selloff.strong
📉 Resistance Levels:
- $238 - Local high and upper bound of current consolidation zone.moderate
- $250 - Recent multi-month high, psychological and technical resistance.strong


No comments yet. Be the first to share your thoughts!