![Solana Market Cap ATH vs Price: How Token Unlocks Are Changing the Game [2025 Analysis]](/image/legacy/wp/5/assets/50cdc114f0dd4376-solana-market-cap-ath-vs-price-how-token-unlocks-are-changing-the-game-2025-analysis-7970e65f-df63-4bd4-a317-2554f057e83.png)
Solana’s relentless growth in 2025 has been punctuated by dramatic price swings, record-breaking market capitalization, and a new set of challenges for investors. As of September 21,2025, Solana (SOL) is trading at $238.54 with a market capitalization of approximately $130.17 billion. This puts SOL just below its all-time high (ATH) of $294.85 reached on January 19,2025, marking an era where the interplay between price action and token unlocks is redefining the landscape for traders and long-term holders alike.
Solana Market Cap ATH: Contextualizing the Numbers
The surge to Solana’s ATH market cap earlier this year was fueled by a wave of developer activity, ecosystem expansion, and renewed institutional interest. However, the gap between SOL’s ATH ($294.85) and its current price ($238.54) is not merely the result of macro trends or crypto sentiment cycles - it is tightly linked to the network’s tokenomics and scheduled unlock events.
The significance of this divergence becomes clear when examining Solana’s circulating supply dynamics. On March 1,2025, approximately 112 million SOL tokens were unlocked, representing about 23% of total supply (source). This event injected over $2 billion worth of tokens into the market almost overnight. Predictably, volatility spiked and sellers briefly overwhelmed buyers as early investors moved to realize gains or rebalance portfolios.
Token Unlocks Explained: The Mechanics Behind Volatility
Token unlocks refer to pre-scheduled releases of previously locked tokens into the circulating supply - often stemming from vesting schedules for team members, early backers, or ecosystem incentives. In Solana’s case, these events are highly visible on-chain and closely watched by both quantitative trading desks and retail speculators.
The March 1 unlock was followed by another significant event on May 25, when a linear release mechanism began distributing around $80 million worth of SOL over one week (source). While smaller in scale than March’s event, it still contributed to short-term downward pressure as traders anticipated increased sell-side liquidity. The pattern is clear: each major unlock brings with it a period of uncertainty as market participants digest the new supply.
Visualizing Price vs Market Cap During Unlock Events
Solana Technical Analysis Chart
Analysis by Evelyn Mercer | Symbol: BINANCE:SOLUSDT | Interval: 1D | Drawings: 8
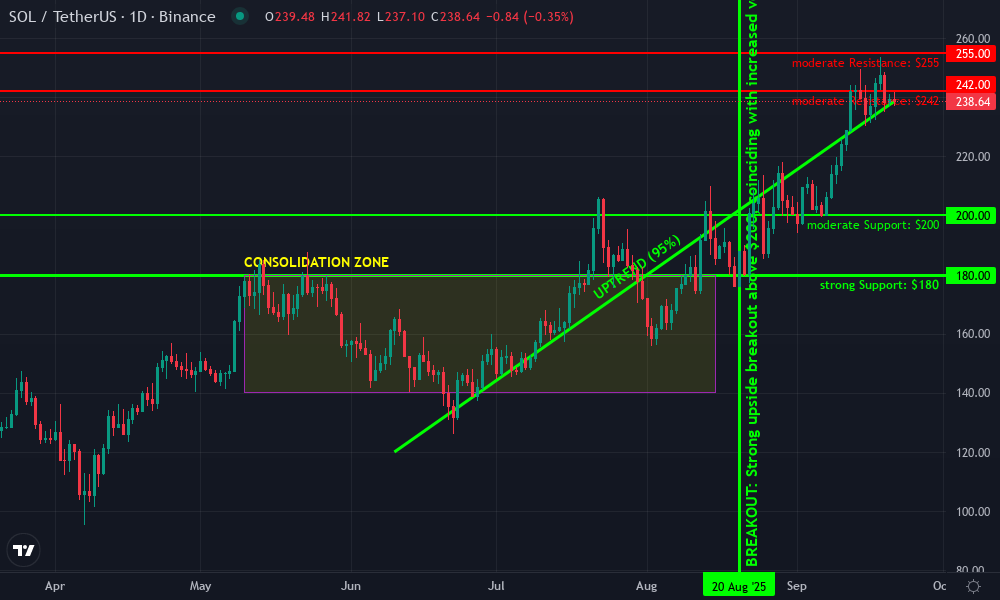
Technical Analysis Summary
Begin by drawing a primary uptrend line from the June 2025 local low near $120 to the current price level in late September 2025 at $238.54, highlighting the persistent bullish structure. Place horizontal lines to mark clear support zones at $200 (recent breakout and prior resistance), $180 (consolidation area), and $160 (historical support from May-July 2025). Mark resistance at $242 (recent swing high) and $255 (next psychological level and price congestion from early September). Annotate the March and May 2025 periods with vertical lines and callouts to indicate the token unlock events and subsequent volatility. Use rectangles to highlight the consolidation phase between $140-$180 from May to August 2025 and the recent acceleration from $200 to $240. Text and callouts should be added for risk events, such as potential future unlocks and the price’s proximity to the all-time high of $294.85.
Risk Assessment: medium
Analysis: While the technical uptrend is robust and SOL has demonstrated resilience post-unlock events, the risk of further unlock-related volatility remains high. Price is extended near resistance, and macro events could trigger sharp corrections. Conservative entries at confirmed supports are advised, with strict risk controls.
Evelyn Mercer's Recommendation: Wait for pullbacks to strong support zones ($200 or $180) before considering new positions. Avoid buying into strength near immediate resistance. Monitor token unlock schedules diligently, and set protective stop losses below $160.
Key Support & Resistance Levels
📈 Support Levels:
- $200 - Former resistance and recent breakout retest zone; likely initial support if price pulls back. moderate
- $180 - Long consolidation and high-volume area from May to August 2025; strong historical support. strong
- $160 - Major base formed during the May-July 2025 correction; structural support. strong
📉 Resistance Levels:
- $242 - Recent swing high and immediate resistance just above current price. moderate
- $255 - Psychological and chart resistance, marking congestion from early September 2025. moderate
- $294.85 - All-time high from January 2025; major resistance if bullish momentum continues. strong
Trading Zones (low risk tolerance)
🎯 Entry Zones:
- $200 - Pullback to prior breakout and retest of support, offering a lower-risk entry aligned with conservative risk management. low risk
- $180 - Historical consolidation and proven support zone; ideal for risk-averse entries if market corrects. low risk
🚪 Exit Zones:
- $242 - Take profit at first resistance above current price, especially in light of recent volatility. 💰 profit target
- $255 - Secondary profit target at next resistance if momentum persists. 💰 profit target
- $160 - Stop loss below major support, protecting capital in case of renewed sell-off. 🛡️ stop loss
Technical Indicators Analysis
📊 Volume Analysis:
Pattern: Volume spikes coincide with token unlock events and breakout moves, confirming periods of high participation and volatility.
Monitor for abnormal volume surges as early warning of volatility, especially around unlock schedules. Low volume during consolidation between $140-$180 supports the accumulation thesis.
📈 MACD Analysis:
Signal: Likely bullish, given the strong upward price momentum and absence of clear reversal signals, but overextension risk as price nears resistance.
MACD would likely show overbought conditions with high bullish momentum. Watch for bearish divergence or MACD cross as warning of near-term correction.
Applied TradingView Drawing Utilities
This chart analysis utilizes the following professional drawing tools:
Disclaimer: This technical analysis by Evelyn Mercer is for educational purposes only and should not be considered as financial advice. Trading involves risk, and you should always do your own research before making investment decisions. Past performance does not guarantee future results. The analysis reflects the author's personal methodology and risk tolerance (low).
This evolving supply landscape makes traditional chart analysis less predictive unless traders integrate tokenomics data into their models. For example:
- Market Cap ATH: Driven by both rising prices and expanding circulating supply
- Price Dips: Often coincide with large-scale unlocks as new tokens hit exchanges
- Bounces: Occur once excess liquidity is absorbed or long-term holders step in to accumulate at perceived discounts
Solana Price Prediction: What Do Models Say for Late 2025?
The interplay between circulating supply shocks and underlying demand has made forecasting more nuanced than ever before. DigitalCoinPrice projects an average SOL price of $315.20 for all of 2025 (source) - notably higher than today’s $238.54 spot rate - while other analysts see continued volatility as further unlocks loom.
Solana (SOL) Price Prediction 2026-2031: Analyst Consensus & Market Scenarios
Based on current market data, token unlock events, and major analyst forecasts as of September 2025
| Year | Minimum Price (Bearish) | Average Price (Consensus) | Maximum Price (Bullish) | % Change (Avg YoY) | Key Scenario/Insight |
|---|---|---|---|---|---|
| 2026 | $210.00 | $384.50 | $480.00 | +61% | Recovery after 2025 volatility; ecosystem growth balances unlock impact |
| 2027 | $265.00 | $559.30 | $720.00 | +45% | Major DeFi/NFT adoption; token supply stabilizes |
| 2028 | $310.00 | $640.00 | $860.00 | +14% | Regulatory clarity, improved scalability; competition intensifies |
| 2029 | $285.00 | $700.00 | $950.00 | +9% | Market consolidation, global crypto adoption increases |
| 2030 | $320.00 | $765.00 | $1,050.00 | +9% | Institutional investment, new use cases (RWAs, AI) |
| 2031 | $380.00 | $845.00 | $1,200.00 | +10% | Potential for new ATH; Solana ecosystem matures |
Price Prediction Summary
Solana (SOL) is expected to see significant price appreciation from 2026 through 2031, with average prices rising from $384.50 in 2026 to $845.00 by 2031. While large token unlocks and market volatility may cause short-term declines, ongoing network adoption, technology upgrades, and increasing institutional interest are likely to drive long-term value. The minimum and maximum price projections reflect both bearish and bullish market cycles, offering a comprehensive outlook for investors.
Key Factors Affecting Solana Price
- Impact of scheduled token unlocks on circulating supply and price volatility
- Continued growth of DeFi, NFT, and Web3 projects on Solana
- Regulatory developments in major jurisdictions (US, EU, Asia)
- Advancements in Solana's scalability, security, and developer ecosystem
- Competition from Ethereum, Layer-2s, and emerging blockchains
- Institutional adoption and integration with traditional finance
- Global macroeconomic trends and crypto market sentiment
Disclaimer: Cryptocurrency price predictions are speculative and based on current market analysis. Actual prices may vary significantly due to market volatility, regulatory changes, and other factors. Always do your own research before making investment decisions.
This divergence between model projections and real-time price underscores why Solana chart analysis in 2025 must account for both technical patterns and upcoming token release schedules.
For traders and investors, the lesson is clear: price action alone is no longer sufficient to anticipate Solana’s next move. Instead, a hybrid approach that overlays unlock calendars with market cap and order book data offers a more robust trading signal. This is particularly relevant during periods like September 2025, when SOL’s price at $238.54 reflects both renewed buying interest and residual caution from the spring unlock events.
Solana Trading Signals: Navigating Volatility in Real Time
The most successful participants in the Solana ecosystem this year have been those who recognized that major unlocks create both risk and opportunity. Quantitative funds have increasingly built models that factor in not just technical support/resistance levels but also the precise timing and size of upcoming releases. Retail traders are catching on, using social sentiment tools and on-chain analytics to front-run potential dips or accumulate ahead of anticipated rebounds.
Key Strategies for Trading Solana During Token Unlocks
- Monitor Official Token Unlock Schedules: Stay updated with Solana’s official unlock calendar, such as those published on CoinMarketCap and Eldorado.io. Knowing the exact dates and volumes—like the March 1, 2025 unlock of 112 million SOL—helps anticipate potential volatility.
- Analyze Historical Price Reactions: Review how SOL’s price responded to previous unlocks. For example, after the March 1, 2025 unlock, Solana’s price experienced a temporary decline from its ATH of $294.85 to lower levels. Historical patterns can inform entry and exit points.
- Consider Hedging With Derivatives: Platforms like Binance Futures or OKX allow traders to hedge exposure by shorting SOL or using options, which can help manage downside risk during volatile unlock periods.
- Track On-Chain Activity and Whale Movements: Use analytics tools like Dune Analytics and Nansen to monitor large wallet activity and token flows. Significant transfers before or after unlocks may signal impending market moves.
This tactical awareness was evident during the aftermath of the March 1 unlock. While some short-term holders exited positions as prices dipped, long-term believers saw an opportunity to increase exposure at a discount to January’s ATH. The result was a swift recovery once excess supply was absorbed, demonstrating how market structure can shift rapidly as new information is priced in.
Pro tip: Always cross-reference upcoming unlock schedules with liquidity data before making large trades or portfolio adjustments.
Ecosystem Resilience: Beyond Price Fluctuations
Despite these bouts of volatility, Solana’s core metrics remain robust. Developer activity continues to climb, NFT volume on Solana marketplaces rivals Ethereum at times, and market capitalization remains north of $130 billion. Even meme coins like Bonk are leveraging burn mechanisms and DAO governance to foster more sustainable tokenomics within the broader ecosystem.
As we approach Q4 2025, attention will turn to how future unlocks are managed. Will protocols introduce more sophisticated vesting or staking incentives? Can DeFi products absorb some of the sell pressure by locking up newly released tokens? These questions will shape not only price action but also investor confidence heading into 2026.
Checklist: How To Prepare for Upcoming Unlocks
The bottom line: Solana’s journey from $294.85 ATH down to $238.54, and wherever it heads next, is being rewritten by tokenomics as much as by technology or adoption trends. For those willing to adapt their playbook, this new era presents both challenges and outsized opportunities within one of crypto’s most dynamic ecosystems.


No comments yet. Be the first to share your thoughts!