
Solana’s meteoric rise in 2025 has forced the traditional finance world to take notice. In recent months, a viral chart juxtaposing Solana’s market cap with the Nasdaq Composite Index has sparked heated debate across trading desks, Twitter threads, and crypto Discords. The message is clear: Solana (SOL) isn’t just another altcoin - it’s a digital asset now rivaling legacy tech indices in both growth rate and cultural momentum.
Solana Blazes Past $248.46: Dissecting the Viral Chart
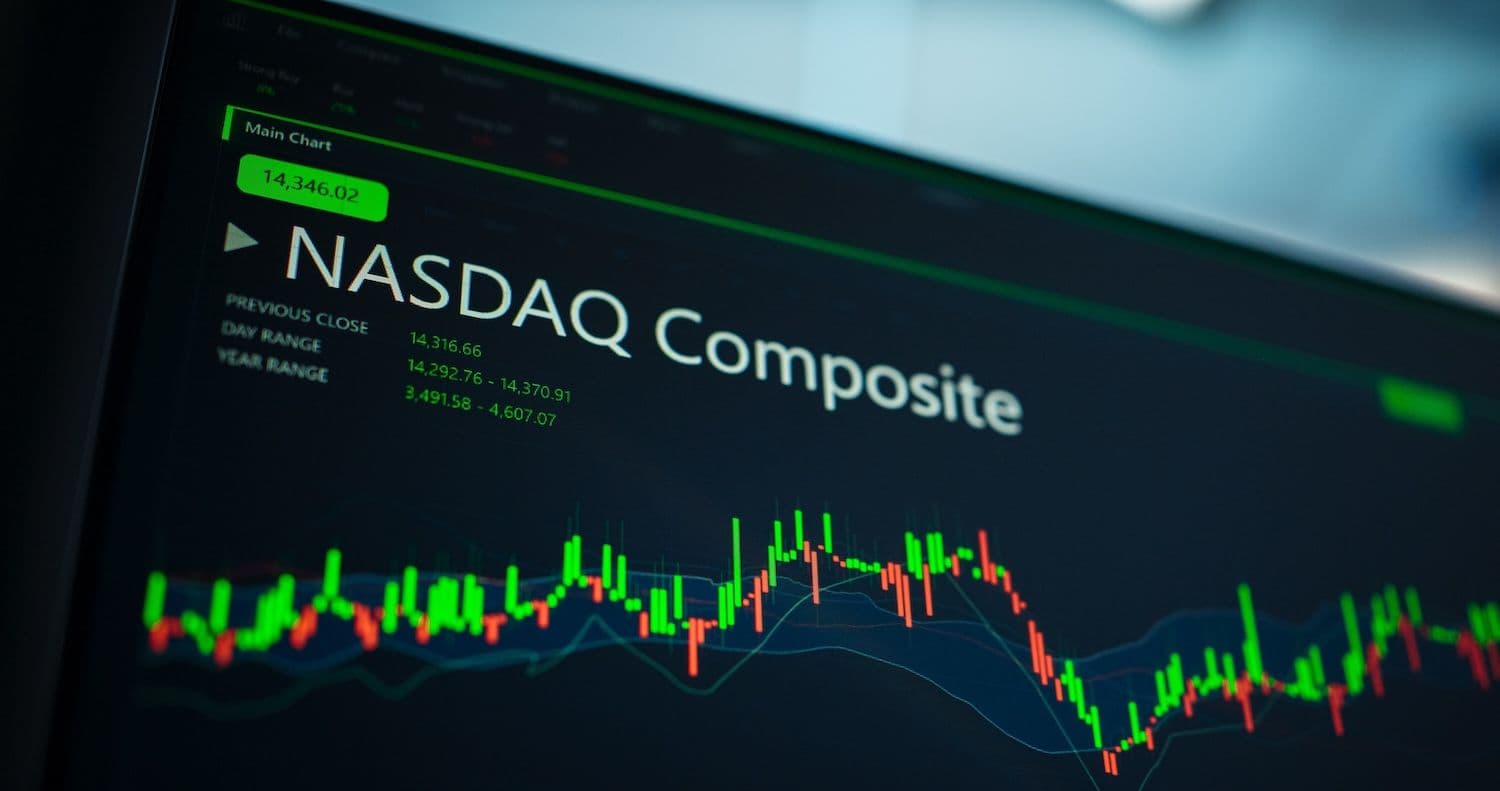
On September 18,2025, Solana surged to $248.46, clocking a 6.43% gain on the day and extending its month-long rally that has left even seasoned traders scrambling for new models. The Nasdaq-100’s QQQ ETF, by comparison, posted a modest 1.21% uptick to $597.13 over the same period. But it’s not just price action - it’s velocity and volatility that have set Solana apart.
The viral chart making rounds online doesn’t just compare numbers; it visualizes a paradigm shift in risk appetite and capital allocation. For years, the Nasdaq represented innovation and high-growth potential; now, with Solana’s explosive ascent and network effects, crypto is forcing its way into that narrative - sometimes outpacing it.
Key Catalysts Behind Solana’s 2025 Surge
What’s fueling this outsized performance? It comes down to three core drivers:
- Institutional Adoption: Heavyweights like Franklin Templeton are filing for SOL-tracking ETFs, signaling a new era of legitimacy for the token among Wall Street pros.
- Regulatory Winds: The US government’s proposal of a national cryptocurrency reserve - with Solana included alongside Bitcoin - is turbocharging institutional confidence.
- Tech Edge: With unmatched blockchain scalability (think sub-second finality and micro-fees), Solana has become ground zero for DeFi innovation and on-chain trading volume spikes.
This triple threat has triggered an unprecedented influx of capital into the Solana ecosystem. Daily trading volumes have shattered previous records as new dApps launch weekly and DeFi protocols migrate from slower chains seeking cost efficiency and throughput.
Solana Technical Analysis Chart
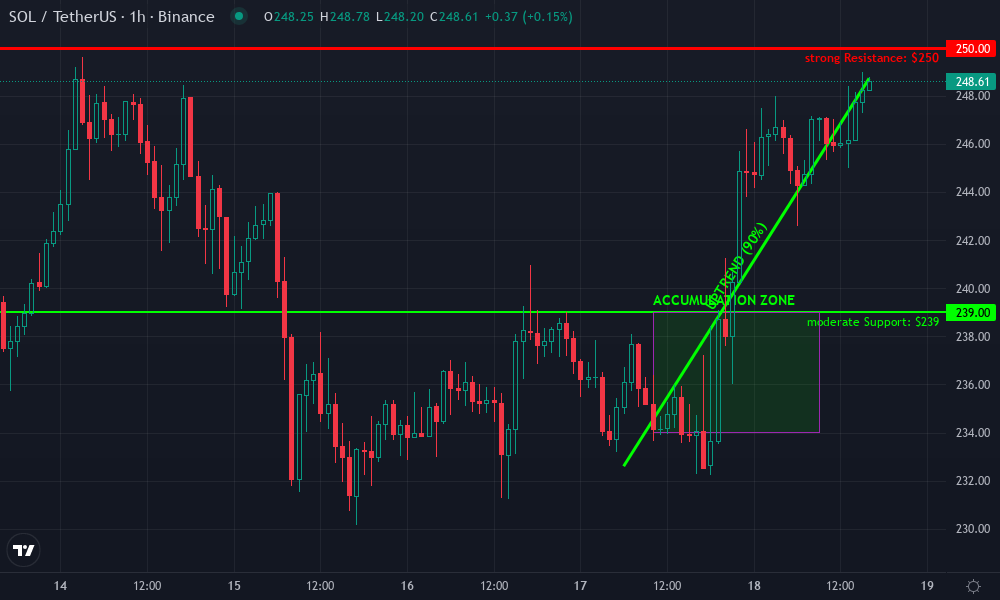
Analysis by Graham Hensley | Symbol: BINANCE:SOLUSDT | Interval: 1h | Drawings: 6
Technical Analysis Summary
Here's how I'd break down the action on this 1h SOLUSDT chart as of late September 2025, using my aggressive, technical approach: 1. Draw a strong uptrend line from the recent low around $232.55 (mid-September 18th) up to the current price at $248.48, highlighting the V-shaped recovery and momentum shift. Use 'trend_line'. 2. Mark immediate horizontal resistance at $248.80 (current 24h high), and support at $244.00 and $238.00 (prior consolidation pivots). Use 'horizontal_line'. 3. Identify the short-term accumulation range from $232.55 to $238.00 (Sep 16-18), and the current breakout zone above $246.00. Use 'rectangle' or 'date_price_range'. 4. Highlight the recent bullish volume spike (if visible) with 'callout' or 'text' to annotate the momentum shift. 5. Project a profit target zone between $250.00-$254.00, just above the current high, using 'rectangle' or 'order_line'. 6. Place stop-loss suggestion near $244.00 (recent support), using 'order_line'. This chart is screaming for aggressive plays given the strong bounce and fresh highs. Watch for a possible fakeout at $248.80, but momentum is currently with the bulls.
Risk Assessment: high
Analysis: Market is in high-momentum breakout mode following bullish news and strong technical reversal. Volatility is elevated and price could snap back if breakout fails.
Graham Hensley's Recommendation: Trade aggressively with tight stops and scale into strength on breakout confirmation. Be nimble—if price rejects at $248.80, flip bias quickly and protect capital.
Key Support & Resistance Levels
📈 Support Levels:
- $244 - Recent breakout support and prior resistance flip. moderate
- $238 - Major consolidation support from earlier in the week. strong
📉 Resistance Levels:
- $248.8 - Intraday high and current resistance ceiling. strong
- $250 - Psychological round number and likely magnet for bulls. moderate
Trading Zones (high risk tolerance)
🎯 Entry Zones:
- $248.8 - Breakout above resistance with momentum confirmation. high risk
- $244 - Pullback entry to prior support if price rejects at highs. medium risk
🚪 Exit Zones:
- $250 - First profit target at psychological level above breakout. 💰 profit target
- $254 - Stretched target if momentum continues. 💰 profit target
- $244 - Stop-loss just below recent support to cap risk. 🛡️ stop loss
Technical Indicators Analysis
📊 Volume Analysis:
Pattern: Look for a volume spike on the breakout above $248.80 to confirm the move.
Volume confirmation is critical for aggressive breakouts; if volume is flat, risk of fakeout is high.
📈 MACD Analysis:
Signal: Bullish crossover likely given the price momentum, but needs confirmation on aggressive timeframes.
If MACD is not yet crossed, wait for the momentum shift before sizing in aggressively.
Applied TradingView Drawing Utilities
This chart analysis utilizes the following professional drawing tools:
Disclaimer: This technical analysis by Graham Hensley is for educational purposes only and should not be considered as financial advice. Trading involves risk, and you should always do your own research before making investment decisions. Past performance does not guarantee future results. The analysis reflects the author's personal methodology and risk tolerance (high).
The New Face of Crypto Market Maturity
The near-parity between Solana’s market cap trajectory and the Nasdaq Composite isn’t just an optical illusion - it marks an inflection point in investor psychology. Digital assets are no longer fringe bets; they’re becoming core portfolio holdings for funds chasing alpha beyond traditional equities.
If you want to dive deeper into how these dynamics are playing out at scale - including daily trade volume comparisons and what sets Solana apart from Nasdaq in terms of raw network activity - check out our dedicated breakdown at Solana vs Nasdaq: Visualizing the Surge in Solana Network Trading Volume.
Solana (SOL) Price Prediction 2026-2031
Professional outlook based on current 2025 market momentum, institutional adoption, and macroeconomic factors.
| Year | Minimum Price | Average Price | Maximum Price | Year-over-Year Change (Avg) | Scenario Insights |
|---|---|---|---|---|---|
| 2026 | $175.00 | $285.00 | $400.00 | +14.7% | Consolidation post-ETF euphoria; possible regulatory headwinds. |
| 2027 | $210.00 | $345.00 | $520.00 | +21.0% | Renewed bull cycle, further TradFi integration, DeFi growth. |
| 2028 | $260.00 | $420.00 | $650.00 | +21.7% | Mainstream adoption accelerates; global regulatory clarity emerges. |
| 2029 | $320.00 | $510.00 | $820.00 | +21.4% | Continued network expansion; possible competition intensifies. |
| 2030 | $400.00 | $610.00 | $1,000.00 | +19.6% | Potential for $1T market cap; mass-scale tokenization & dApp ecosystem. |
| 2031 | $375.00 | $540.00 | $950.00 | -11.5% | Market matures; cyclical correction or stabilization after rapid growth. |
Price Prediction Summary
Solana's price trajectory is expected to remain robust through 2030, benefiting from institutional adoption, ETF listings, technological advances, and growing use cases. While volatility and cyclical corrections are likely, the average price could more than double by 2030 compared to 2025 levels. The $1,000 mark is possible in a strong bull scenario, but investors should anticipate periods of consolidation and corrections, especially as the market matures.
Key Factors Affecting Solana Price
- Institutional adoption (ETFs, crypto reserves, TradFi integration)
- Regulatory landscape in the U.S. and globally
- Solana's technological edge (speed, fees, scalability)
- Expansion of DeFi, NFT, and real-world asset tokenization on Solana
- Macro market cycles and speculative sentiment
- Competition from other high-throughput blockchains (e.g., Ethereum, Avalanche, Sui)
- Potential network security or technological challenges
Disclaimer: Cryptocurrency price predictions are speculative and based on current market analysis. Actual prices may vary significantly due to market volatility, regulatory changes, and other factors. Always do your own research before making investment decisions.
The Risks Lurking Beneath the Hype
No rally comes without shadows. The same volatility that makes SOL attractive also introduces outsized risk. Regulatory uncertainty remains high despite positive headlines, while technical hiccups or security events could quickly erode trust (and price). For traders used to equities’ relative calm, crypto still demands nerves of steel.
But the risk-reward calculus in 2025 is fundamentally different. Solana’s blockchain scalability and relentless on-chain innovation have created a feedback loop: more users, more dApps, more capital - and, crucially, more scrutiny. Legacy finance players are watching for cracks, while DeFi degens are chasing every new protocol launch. The result? A market that’s both exhilarating and unforgiving.
Solana’s daily trades in 2025 routinely eclipse those of entire mid-cap stock exchanges, thanks to algorithmic bots, NFT marketplaces, and the ongoing memecoin renaissance. This isn’t just speculation; it’s a living laboratory for decentralized finance at scale.
What Sets Solana Apart From Nasdaq?
Here’s the core distinction: while the Nasdaq-100 aggregates established tech giants with predictable quarterly earnings, Solana is an open-source network where value accrues directly from usage and developer activity. Every spike in transaction count or TVL (now above $15B) feeds back into ecosystem growth - not just price.
Key Differences: Solana Blockchain vs. Nasdaq Trading
- Nature of Activity: Solana processes decentralized, permissionless blockchain transactions (including DeFi, NFTs, and dApps), while Nasdaq handles regulated, centralized equity trades of publicly listed companies.
- Volume Measurement: Solana tracks on-chain transaction count and Total Value Locked (TVL)—recently surpassing $15 billion—whereas Nasdaq reports equity trading volume and market capitalization via instruments like the Invesco QQQ Trust (QQQ) at $597.13.
- Asset Types: Solana supports cryptocurrencies (SOL), tokens, and digital assets native to its blockchain. Nasdaq lists stocks and ETFs of traditional companies such as Apple and Microsoft.
- Market Hours: Solana operates 24/7/365 with no downtime, while Nasdaq trading is limited to weekdays during set hours (typically 9:30 AM–4:00 PM ET), with after-hours trading available for select securities.

- Transaction Speed and Fees: Solana boasts sub-second finality and ultra-low fees (often fractions of a cent), whereas Nasdaq trades settle in seconds to days with brokerage and exchange fees that are generally higher.
- Transparency and Accessibility: Solana transactions are publicly viewable on-chain and accessible to anyone with internet, while Nasdaq requires brokerage accounts and provides limited real-time public data.
This dynamic has made SOL a magnet for both institutional flows and retail hype cycles. The average annualized return for Solana remains orders of magnitude higher than legacy indices - but so does its volatility profile. That’s why technical traders watch for rising wedge formations or volume divergences with hawk-like focus.
Where Does Crypto Go From Here?
The viral chart comparing Solana vs Nasdaq is already shaping narratives for 2026 and beyond. If current momentum holds - with SOL trading at $248.46 as of today - we could see further convergence between digital asset markets and traditional equities in terms of both capital flows and investor demographics.
The next phase? Expect more ETFs tracking on-chain assets, deeper integration of crypto into payrolls and corporate treasuries, and a new wave of fintech startups bridging these worlds. But don’t expect the ride to get any smoother; if anything, the stakes are only getting higher as crypto matures into a global asset class.
Bottom line: In 2025, Solana isn’t just challenging legacy tech indices - it’s redefining what market leadership looks like in an era dominated by blockchain scalability and real-time network effects. For traders who can surf this volatility without getting wrecked, the edge has never looked sharper.


No comments yet. Be the first to share your thoughts!