
In the summer of 2025, a data-driven comparison between Solana trading volume and the Nasdaq reveals a striking shift in global trading behavior. Both networks have seen explosive growth, but the drivers and implications diverge sharply. Solana’s blockchain is not just keeping pace with traditional finance - it’s setting new standards in speed, efficiency, and market participation.
Solana Network Trading Volume Hits New Highs
The Solana blockchain has witnessed a relentless surge in trading activity throughout 2025. On August 14, Solana recorded a daily volume of $14,664,456,934, followed by $10,855,961,600 on August 15 (Yahoo Finance). The network’s decentralized exchanges (DEXs) have been at the heart of this momentum. By July 2025, cumulative DEX volume smashed through $1.4 trillion for the year (Yahoo Finance), outpacing even Ethereum during key periods.
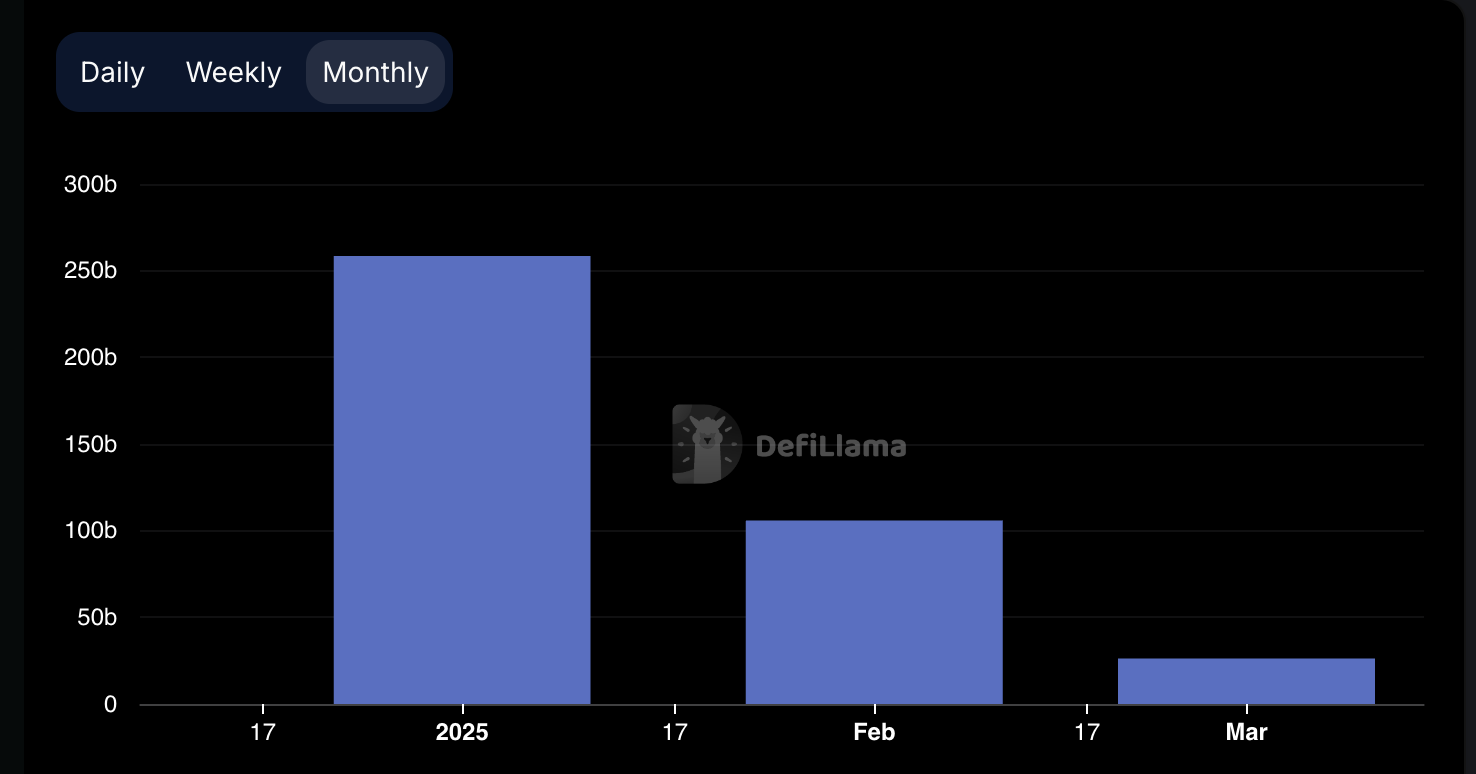
This growth is not an isolated event. In November 2024, Solana’s monthly DEX volume eclipsed $100 billion for the first time - nearly double Ethereum’s $55 billion during the same period (Cointelegraph). By February 2025, Solana maintained its lead with approximately $59.55 billion in monthly DEX trades versus Ethereum’s $34.75 billion (Benzinga).
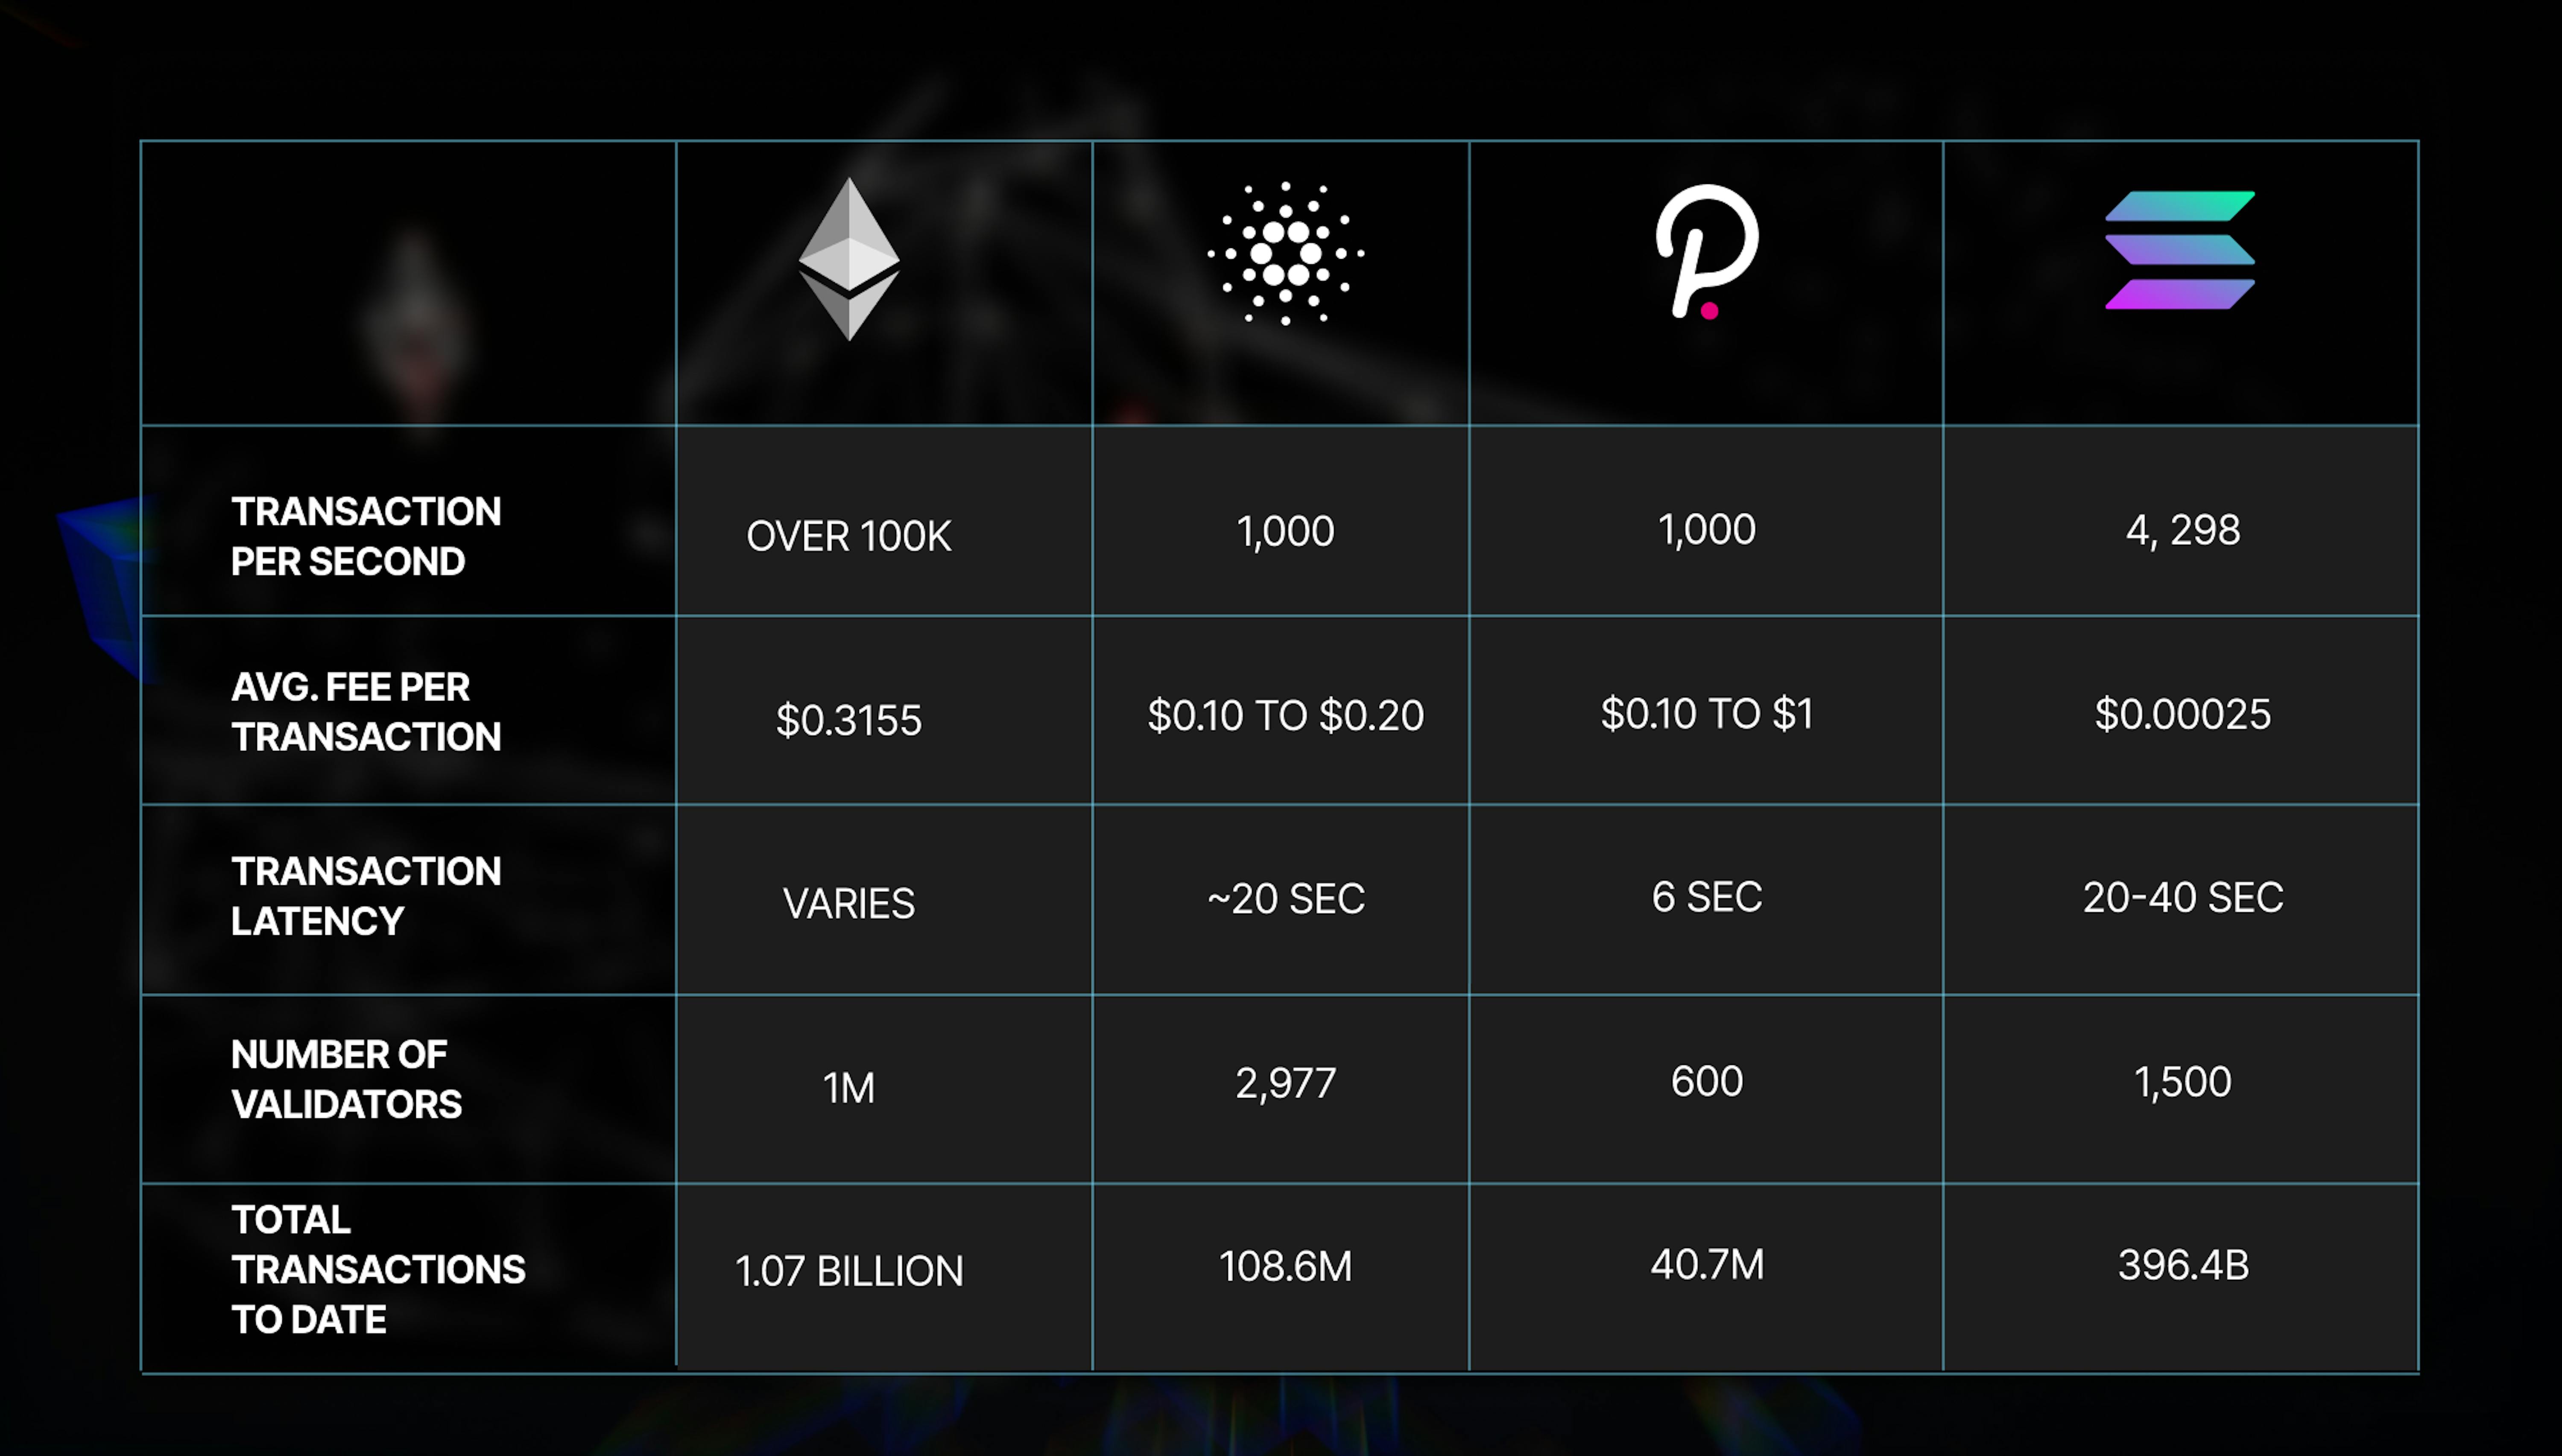
The network’s technological edge is clear: low fees and high throughput are attracting traders at every level. The result? Solana’s ecosystem growth is accelerating at a pace rarely seen in crypto - or legacy markets.
Nasdaq Volume Surges on Macro Volatility
The Nasdaq stock exchange has also posted impressive numbers in 2025. In Q2 alone, Nasdaq reported a 21% increase in market services revenue, setting a quarterly record (Reuters). This uptick is largely attributed to heightened volatility from geopolitical tensions and economic uncertainty - factors that drive traditional traders to seek both risk mitigation and opportunity.
The difference lies in what powers these surges. While Nasdaq benefits from macroeconomic catalysts pushing capital into equities and derivatives, Solana’s rise is rooted in its infrastructure: rapid block finality and near-zero transaction costs make it the platform of choice for DeFi users chasing agility and scale.
Picturing the Surge: Key Metrics Side by Side
Let’s break down the numbers that matter most for traders and analysts:
Key Solana vs Nasdaq Trading Volume Stats (Jul-Aug 2025)
- Solana DEX Monthly Volume (August 2025): Surpassed $27 billion, reflecting a 17% week-on-week gain and continued momentum from earlier in the year.
- Solana DEX Cumulative 2025 Volume: Broke through $1.4 trillion in total decentralized exchange trading volume, underscoring massive growth in DeFi activity on the network.
- Solana Daily Trading Volume (August 15, 2025): Recorded a daily volume of $10,855,961,600 with the SOL price closing at $194.69 per token.
- Nasdaq Q2 2025 Market Services Revenue: Achieved a 21% increase year-over-year, setting a new quarterly record due to heightened trading activity and volatility.
- Nasdaq Trading Volume Surge (July-August 2025): Experienced a significant uptick in trading volumes, driven by macroeconomic volatility and increased activity across equities and derivatives.
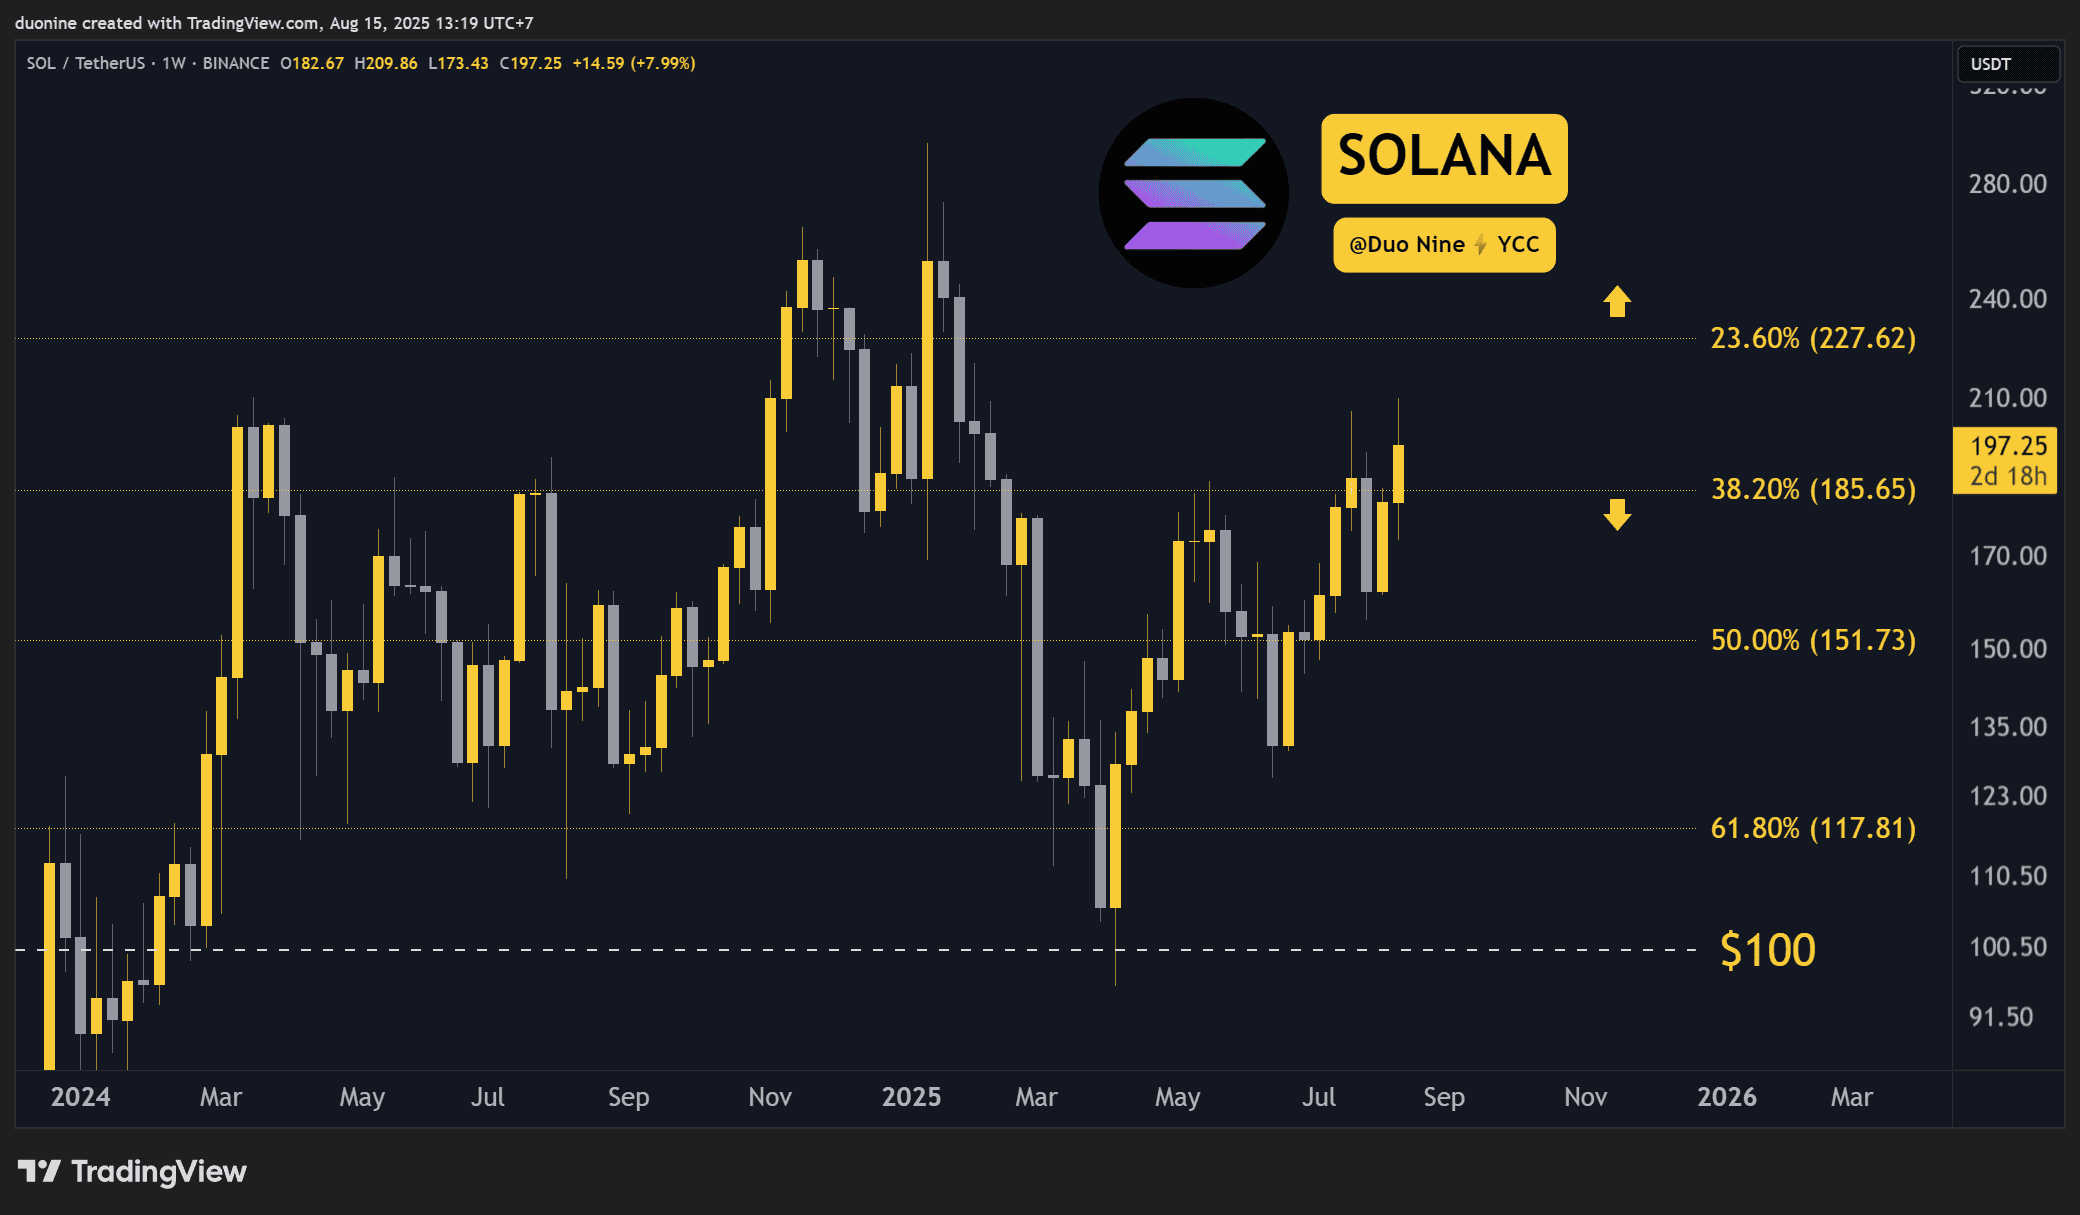
- Solana price: Trading between $192.59 (Aug 15) and $201.59 (Aug 14), peaking above $200 multiple times this week.
- Cumulative Solana DEX volume (2025): Over $1.4 trillion as of July.
- Nasdaq Q2 market services revenue: Up by 21%, driven by record trading volumes across asset classes.
- Ecosystem valuation: Solana market cap surpassed $100 billion for the first time on July 21 (Reddit · r/CryptoCurrency) - another major milestone reflecting global interest.
This data underscores how demand for speed and accessibility on-chain is rivaling even legacy financial institutions like Nasdaq. For those tracking Solana network statistics, these numbers point to sustained ecosystem momentum well into H2 2025.
What’s most striking is the way Solana’s blockchain analytics reveal not just growth, but a fundamental transformation in user behavior. The platform’s ability to process tens of billions in daily trading volume provides $14,664,456,934 on August 14 and $10,855,961,600 on August 15, demonstrates that liquidity is no longer the exclusive domain of centralized exchanges or traditional finance. Instead, retail and institutional participants are increasingly turning to Solana’s DEXs for exposure and execution speed previously unattainable in legacy markets.
Meanwhile, Nasdaq’s surge remains closely tied to external volatility. Its record-breaking Q2 was fueled by unpredictable macro events rather than innovation within its own infrastructure. The contrast is clear: Solana’s advances stem from endogenous network effects, developers building new protocols, memecoin cycles driving speculative frenzy, and DeFi primitives maturing at breakneck speed.
Solana Ecosystem Growth: Beyond Volumes
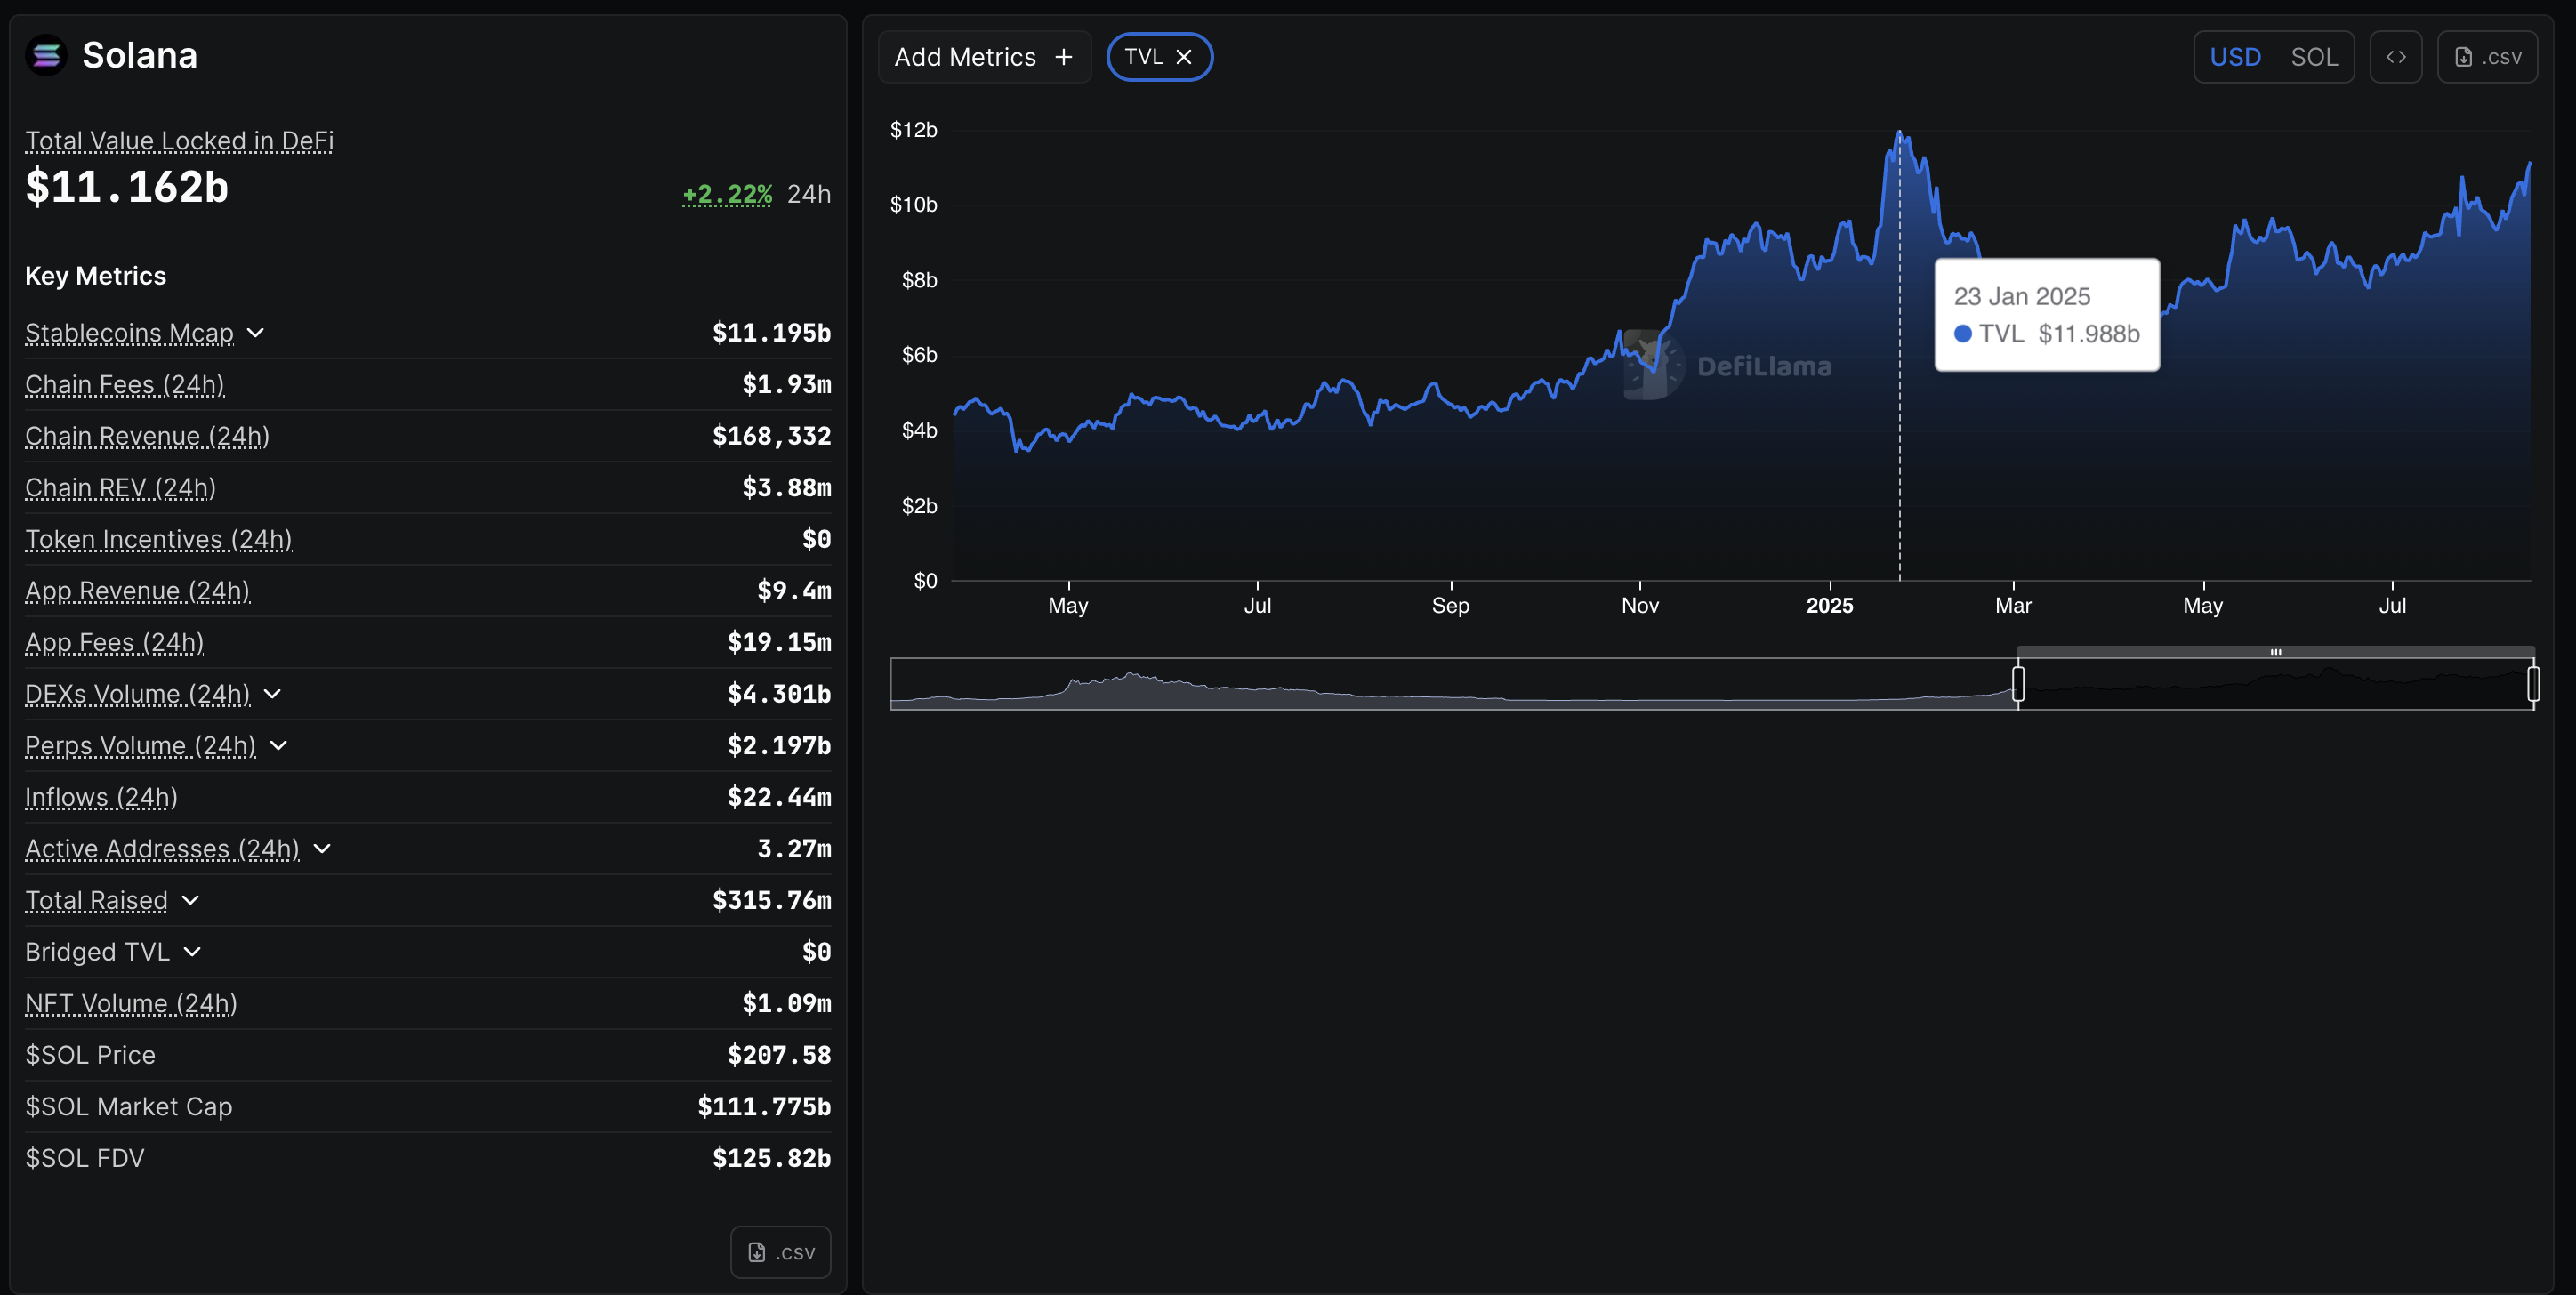
The pace of Solana ecosystem growth in 2025 extends well beyond headline trading volumes. Key metrics such as market capitalization and user activity reinforce the network’s expanding dominance:
Top 5 Metrics Driving Solana's 2025 Ecosystem Growth
- 1. Explosive DEX Volume Surge: Solana's decentralized exchanges (DEXs) recorded a cumulative trading volume exceeding $1.4 trillion in 2025, with monthly volumes peaking at $100 billion in November 2024 and maintaining dominance over Ethereum into 2025.
- 2. Market Cap Breaks $100 Billion: In July 2025, Solana's market capitalization surpassed the $100 billion milestone for the first time, reaching $102.6 billion and solidifying its position among the largest cryptocurrencies.
- 3. Sustained Price Momentum: As of August 15, 2025, Solana (SOL) is trading at $194.69 according to Yahoo Finance, following a period where it reached $251.28 in January 2025, reflecting robust investor confidence and network activity.
- 4. Transaction Throughput Leadership: Solana continues to outpace competitors with its high transaction throughput and low fees, key factors behind its DEX volume dominance and appeal to DeFi traders.
- 5. Double-Digit Weekly DEX Growth: Solana's DEX ecosystem saw a 17% week-on-week volume increase in 2025, climbing to $27 billion and highlighting ongoing growth in user engagement and trading activity.
For example, Solana’s market cap breached the $100 billion threshold for the first time on July 21 (Reddit · r/CryptoCurrency). Daily active addresses have surged alongside network throughput improvements. Even amid volatile price action, SOL ranged from $192.59 to $201.59 mid-August, the network has maintained robust user engagement.
This momentum is reflected in the broader DeFi landscape as well. Solana DEXs not only facilitate massive volumes but also support a thriving ecosystem of lending protocols, NFT marketplaces, and innovative yield strategies, all benefiting from near-instant settlement and minimal fees.
Implications for Traders: Opportunity and Risk
The data-driven reality is that both Solana trading volume 2025 and Nasdaq activity signal elevated opportunity, but also increased risk. For momentum traders and swing strategists like myself, these conditions are ideal for disciplined setups with tight risk management.
Solana vs Major Cryptocurrencies: 6-Month Price Comparison
A real-time comparison of Solana (SOL) and other major cryptocurrencies, highlighting 6-month price performance as of August 15, 2025.
| Asset | Current Price | 6 Months Ago | Price Change |
|---|---|---|---|
| Solana | $183.87 | $131.98 | +39.3% |
| Bitcoin | $117,139.00 | $58,546.05 | +100.1% |
| Ethereum | $4,387.10 | $2,300.97 | +90.7% |
| Binance Coin | $820.35 | $537.56 | +52.6% |
| Cardano | $0.9319 | $0.8142 | +14.5% |
| XRP | $3.06 | $0.5580 | +448.5% |
Analysis Summary
Over the past six months, all major cryptocurrencies have experienced substantial price growth, with Solana rising by 39.3%. Bitcoin and Ethereum more than doubled in value, while XRP saw the most dramatic increase, surging by 448.5%. This reflects a period of strong investor confidence and heightened trading activity across the crypto sector.
Key Insights
- Solana's price increased by 39.3% over six months, outpacing Cardano but trailing behind Bitcoin, Ethereum, and XRP.
- Bitcoin and Ethereum both more than doubled in price, indicating robust market momentum for leading cryptocurrencies.
- XRP experienced the highest 6-month price surge among the compared assets, with a 448.5% increase.
- All listed assets posted positive gains, signaling broad-based bullish sentiment in the crypto market.
This comparison uses real-time market prices and 6-month historical data sourced directly from CoinGecko as of August 15, 2025. Only verified, up-to-date figures provided in the prompt were used to ensure accuracy.
Data Sources:
- Main Asset: https://www.coingecko.com/en/all-cryptocurrencies
- Bitcoin: https://www.coingecko.com/en/all-cryptocurrencies
- Ethereum: https://www.coingecko.com/en/all-cryptocurrencies
- Binance Coin: https://www.coingecko.com/en/all-cryptocurrencies
- Cardano: https://www.coingecko.com/en/all-cryptocurrencies
- XRP: https://www.coingecko.com/en/all-cryptocurrencies
Disclaimer: Cryptocurrency prices are highly volatile and subject to market fluctuations. The data presented is for informational purposes only and should not be considered as investment advice. Always do your own research before making investment decisions.
- Liquidity depth: Solana’s high throughput means slippage remains low even during peak periods, a critical factor for large position sizing.
- Volatility spikes: Macro shocks can still impact crypto assets; correlation between equities (Nasdaq) and digital assets has increased during global uncertainty.
- Ecosystem catalysts: Watch for protocol upgrades or high-profile launches on Solana, they often precede volume surges and price breakouts.
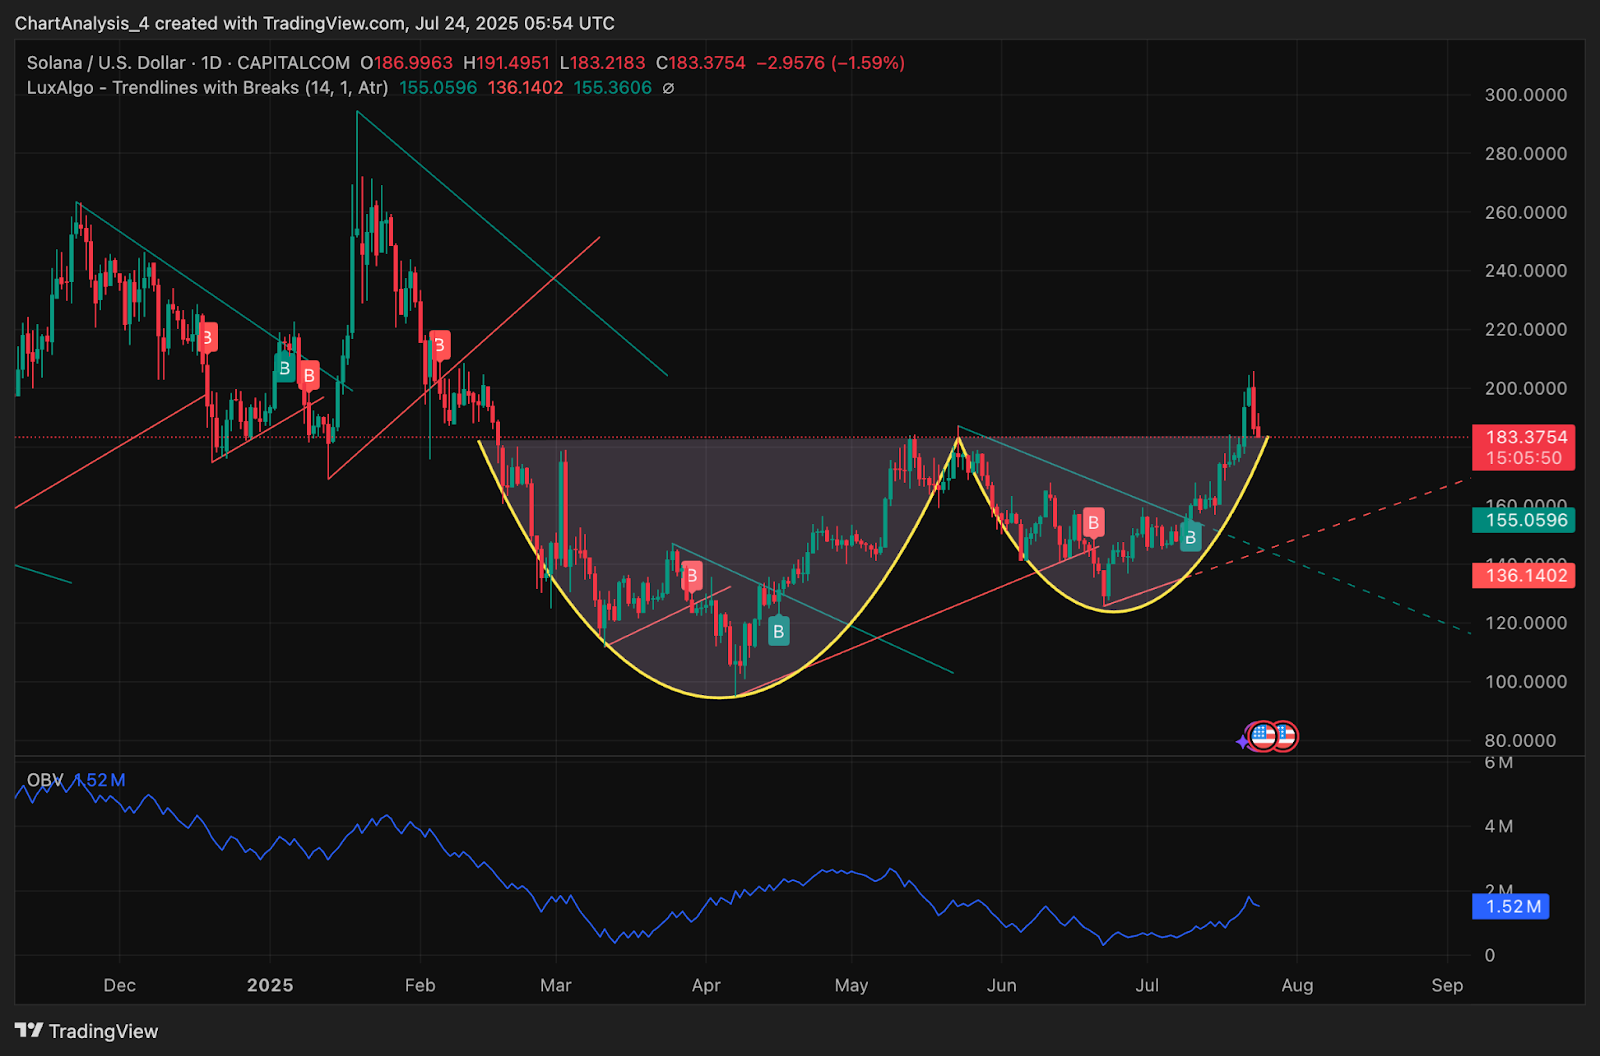
The bottom line? The charts never lie. As of mid-August 2025, SOL trades at $192.59 after repeated tests above $200, a testament to sustained demand despite short-term corrections (Yahoo Finance). The next leg up or down will likely be determined by a combination of macro factors (mirrored on Nasdaq) and internal innovations unique to Solana.
What do you think drives higher trading volume: technological innovation or macro volatility?
Both Solana and Nasdaq have seen record trading volumes recently, but for different reasons. Solana's surge is powered by its fast, low-fee blockchain tech, while Nasdaq's spike comes from global economic uncertainty. Which factor do you believe has a bigger impact on trading volume?
For investors tracking Solana vs NASDAQ, this moment marks a historic convergence where decentralized networks can rival, or even surpass, their traditional counterparts in both scale and sophistication. Stay nimble. Watch the flows. And remember: Charts never lie.


No comments yet. Be the first to share your thoughts!