
Solana is rewriting the record books in 2025. The network’s relentless march forward is defined by staggering transaction throughput, surging blockspace demand, and a laser focus on scalability upgrades. As of July 26,2025, Solana (SOL) trades at $185.23, with a modest 24-hour gain of and $2.25 ( and 0.0123%). But price alone doesn’t capture the story: Solana’s real narrative is written on-chain, where metrics are hitting all-time highs at a breakneck pace.

Solana Blockspace 2025: Record Demand Drives Network Upgrades
In June 2025, Solana processed an astonishing 2.98 billion transactions, vaulting past all other blockchains in both Layer 1 and Layer 2 categories (source). On June 25 alone, the network achieved a jaw-dropping 111.2 million daily transactions, shattering previous records (source). This relentless demand for blockspace has forced core developers to propose aggressive capacity upgrades – most notably SIMD-0286, which aims to increase block size by 66%. The rationale is simple: without scaling block capacity, congestion and fee spikes would undermine user experience and dApp growth.
The technical foundation for this expansion was laid earlier in the year with SIMD-0256, which raised compute unit (CU) limits to 60 million per block. This enabled Solana to sustain approximately 1,700 transactions per second (TPS) during peak hours – a figure that dwarfs most competing chains (source). With SIMD-0286 now under review, the network is poised to leap even further ahead on throughput metrics.
Transaction Volume ATH: The Data Behind Solana’s Dominance
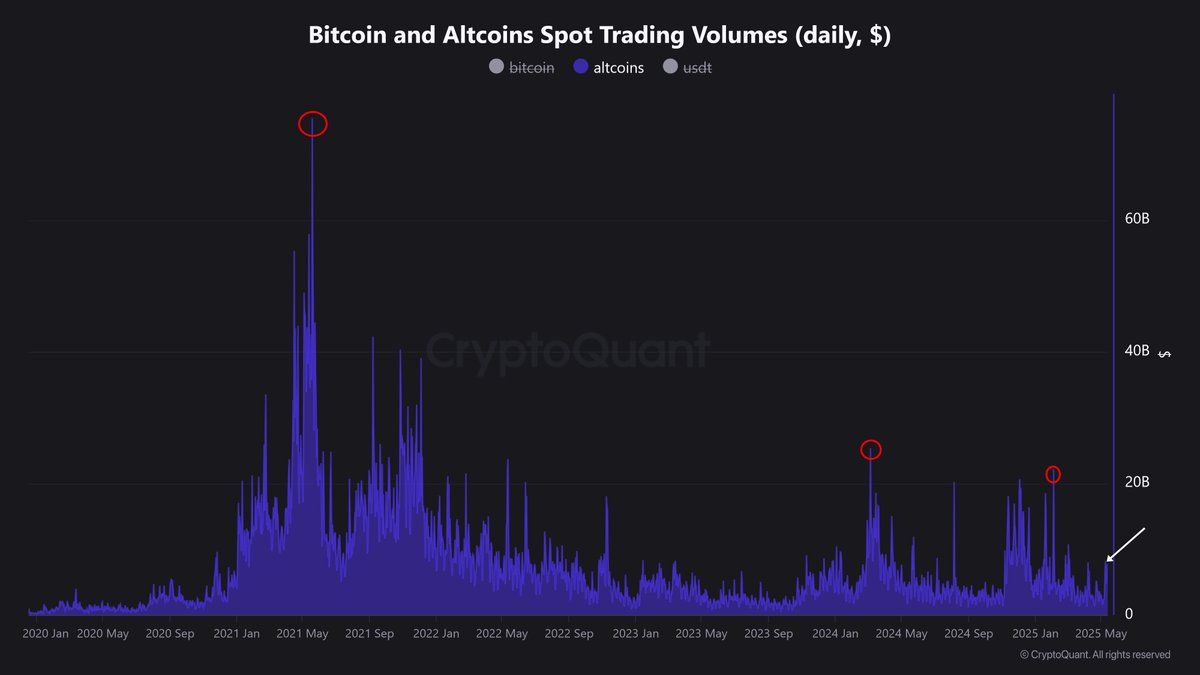
The numbers don’t lie – Solana’s transaction volume has reached an all-time high (ATH). In July alone, the chain exceeded its own June record of 2.98 billion transactions, as documented by independent analysts (@MilkRoadDaily). NFT trading volume on Solana also surged to over $1.2 billion in Q1 2025, marking a robust 30% quarter-over-quarter jump according to CoinLaw data.
This explosion in activity isn’t just headline fodder; it reflects real adoption across DeFi protocols, NFT marketplaces, and high-frequency trading bots that rely on low-latency execution. For traders and ecosystem builders alike, these figures are actionable signals that liquidity and user engagement remain concentrated within Solana’s borders.
Solana (SOL) Price Prediction 2026-2031
Professional price forecast based on Solana’s 2025 momentum, on-chain growth, and network upgrades.
| Year | Minimum Price | Average Price | Maximum Price | Year-over-Year % Change (Avg) | Market Scenario Insights |
|---|---|---|---|---|---|
| 2026 | $160.00 | $220.00 | $285.00 | +18.8% | Continued scalability improvements; minor corrections after 2025 rally; DeFi and NFT growth offset by profit-taking |
| 2027 | $180.00 | $260.00 | $340.00 | +18.2% | Adoption in institutional DeFi and programmable blockspace; regulatory clarity boosts sentiment |
| 2028 | $210.00 | $300.00 | $410.00 | +15.4% | Wider enterprise use cases, stable network upgrades, but increased competition from new L1s |
| 2029 | $250.00 | $355.00 | $500.00 | +18.3% | Possible new bull cycle, integration with AI/IoT, further DeFi and RWAs expansion |
| 2030 | $290.00 | $410.00 | $590.00 | +15.5% | Mainstream adoption, sustained high transaction volumes, robust ecosystem, but macro headwinds limit upside |
| 2031 | $340.00 | $475.00 | $690.00 | +15.9% | Mature ecosystem, dominant position in high-throughput dApps, but slower growth as market matures |
Price Prediction Summary
Solana is projected to maintain strong growth through 2031, fueled by continuous network upgrades, record-breaking transaction volumes, and increasing adoption in DeFi and NFTs. While short-term corrections are possible after sharp rallies, the long-term trajectory remains bullish. The min-max ranges account for both bullish scenarios (mainstream adoption, tech breakthroughs) and bearish risks (market corrections, regulatory pressures, and new competition).
Key Factors Affecting Solana Price
- Sustained network upgrades (e.g., block size increases, SIMD proposals) enabling higher throughput and lower fees.
- Dominance in transaction volume and on-chain activity, outpacing other L1 and L2 chains.
- Growing NFT and DeFi ecosystem, with expanding institutional and enterprise adoption.
- Regulatory developments in major jurisdictions impacting investor confidence and utility.
- Competition from emerging high-performance blockchains and possible market share shifts.
- Macro market cycles, including global risk sentiment, interest rates, and crypto-specific bull/bear phases.
- Potential for new use cases (AI, IoT integration, real-world asset tokenization) enhancing SOL’s value proposition.
Disclaimer: Cryptocurrency price predictions are speculative and based on current market analysis.
Actual prices may vary significantly due to market volatility, regulatory changes, and other factors.
Always do your own research before making investment decisions.
Scalability Upgrades: From Compute Units to BAM Sequencing
The surge in demand has forced Solana’s developer community into rapid-fire innovation mode. Beyond just raising CU limits or expanding block size via SIMD proposals, new infrastructure like Jito Labs’ BAM (Blockspace Allocation Mechanism) is being rolled out to optimize transaction sequencing and reduce MEV (Miner Extractable Value). BAM introduces programmable control over blockspace allocation – a technical leap designed to keep fees stable even as network usage hits new peaks (source).
The net result? A blockchain capable of handling not just today’s load but tomorrow’s exponential growth curves as well. For anyone trading or building within the ecosystem, these upgrades are more than technical milestones – they’re the foundation upon which sustainable value accrues.
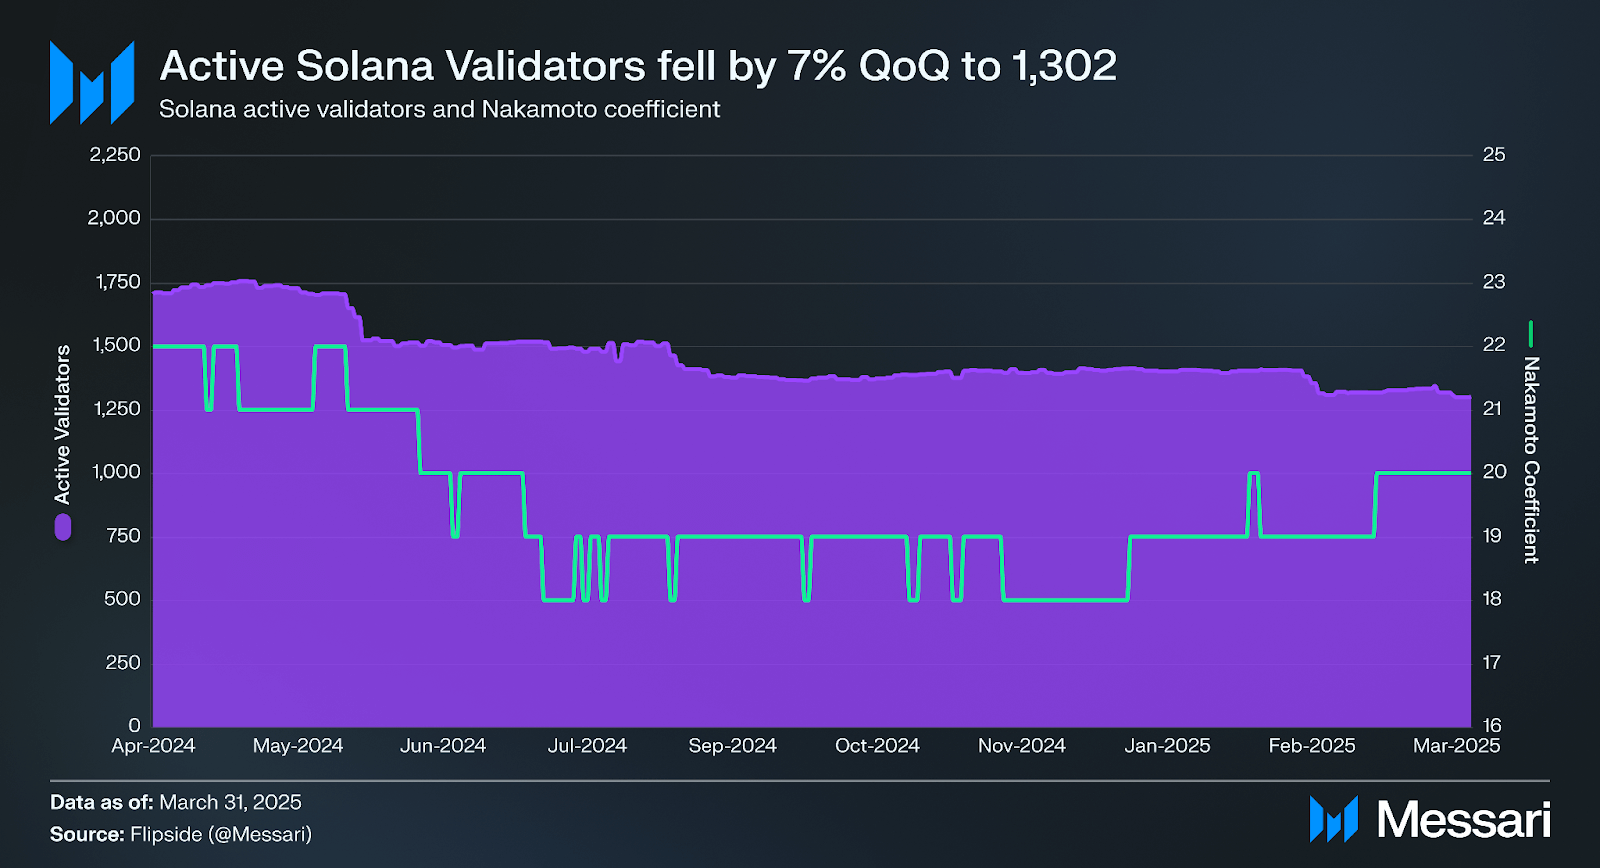
For validators and node operators, the implications are equally profound. As blockspace expands and transaction throughput rises, the network’s security and decentralization profile also improve. Validator counts are trending upward, supporting a more resilient infrastructure against both technical failures and coordinated attacks. This growth in validator participation is critical for maintaining Solana’s performance edge without sacrificing trustlessness or censorship resistance.

Ecosystem Impact: DeFi, NFTs, and Real-World Adoption
Solana’s record-breaking blockspace expansion isn’t just a technical feat, it’s a catalyst for ecosystem-wide acceleration. DeFi protocols on Solana have seen total value locked (TVL) rebound sharply in 2025, fueled by lower fees and improved execution speeds. NFT marketplaces are thriving as creators flock to the chain for its cost-efficient minting and trading environment. With over $1.2 billion in Q1 2025 NFT trading volume alone, Solana has cemented itself as a go-to platform for digital collectibles (source).
This momentum is attracting not only crypto-native projects but also mainstream brands experimenting with blockchain utility, ranging from loyalty programs to ticketing systems that leverage Solana’s high throughput and finality guarantees. The compounding effect is clear: more real-world adoption drives more on-chain activity, which in turn justifies continued investment into network upgrades.
Key Drivers of Solana’s 2025 Ecosystem Growth
-
Block Capacity Upgrades: In 2025, Solana implemented a 20% increase in block capacity to 60 million compute units (CUs) and is considering a further 66% block size bump via proposal SIMD-0286, directly addressing surging demand for blockspace and enabling higher throughput.
-
Record Transaction Volumes: Solana processed 2.98 billion transactions in June 2025 and achieved a daily record of 111.2 million transactions on June 25, outpacing all other Layer 1 and Layer 2 chains.
-
Jito’s BAM Integration: The introduction of BAM by Jito Labs has improved transaction sequencing, reduced MEV (Miner Extractable Value), and enabled programmable control over blockspace, enhancing network efficiency.
-
Explosive NFT and DeFi Activity: Solana recorded over $1.2 billion in NFT trading volume in Q1 2025, a 30% increase from the previous quarter, reflecting robust ecosystem engagement and developer activity.
-
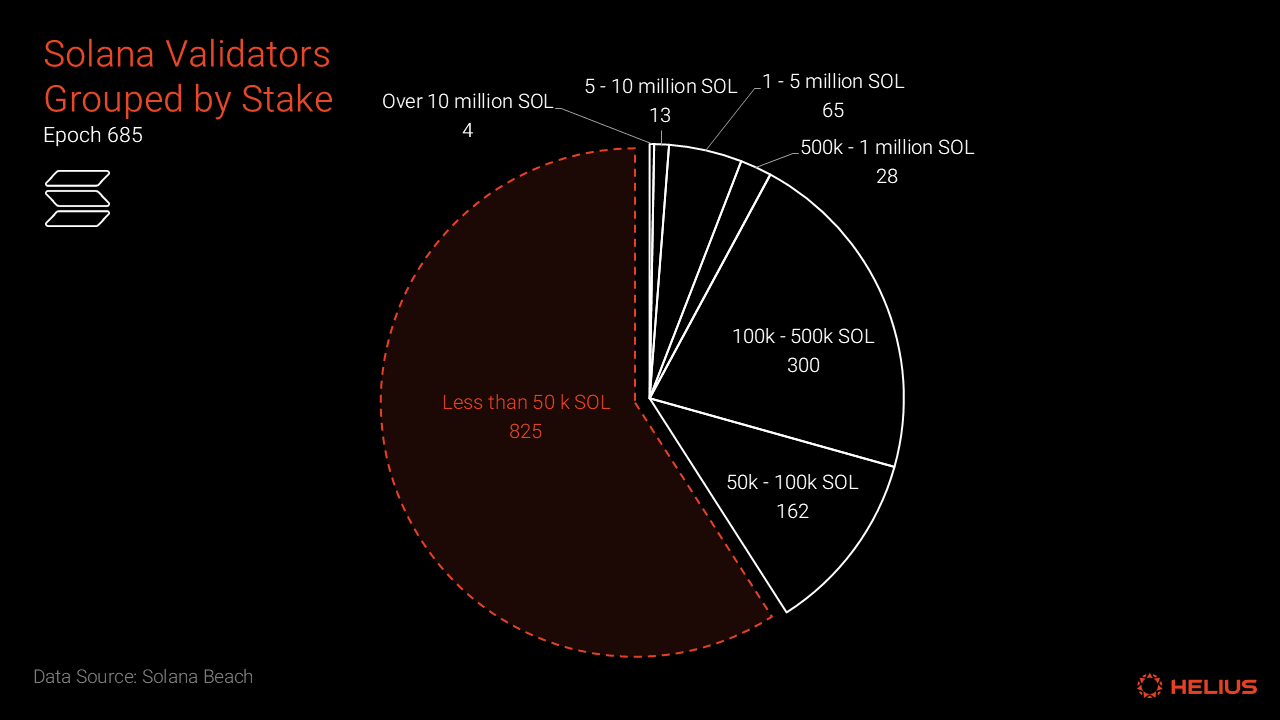
Validator Growth and Decentralization: The network has seen a steady rise in validator counts and improvements in decentralization, strengthening security and supporting the expanding ecosystem.
-
Strong Market Performance: As of July 26, 2025, Binance-Peg SOL (SOL) trades at $185.23, reflecting investor confidence and sustained demand for Solana’s native token.
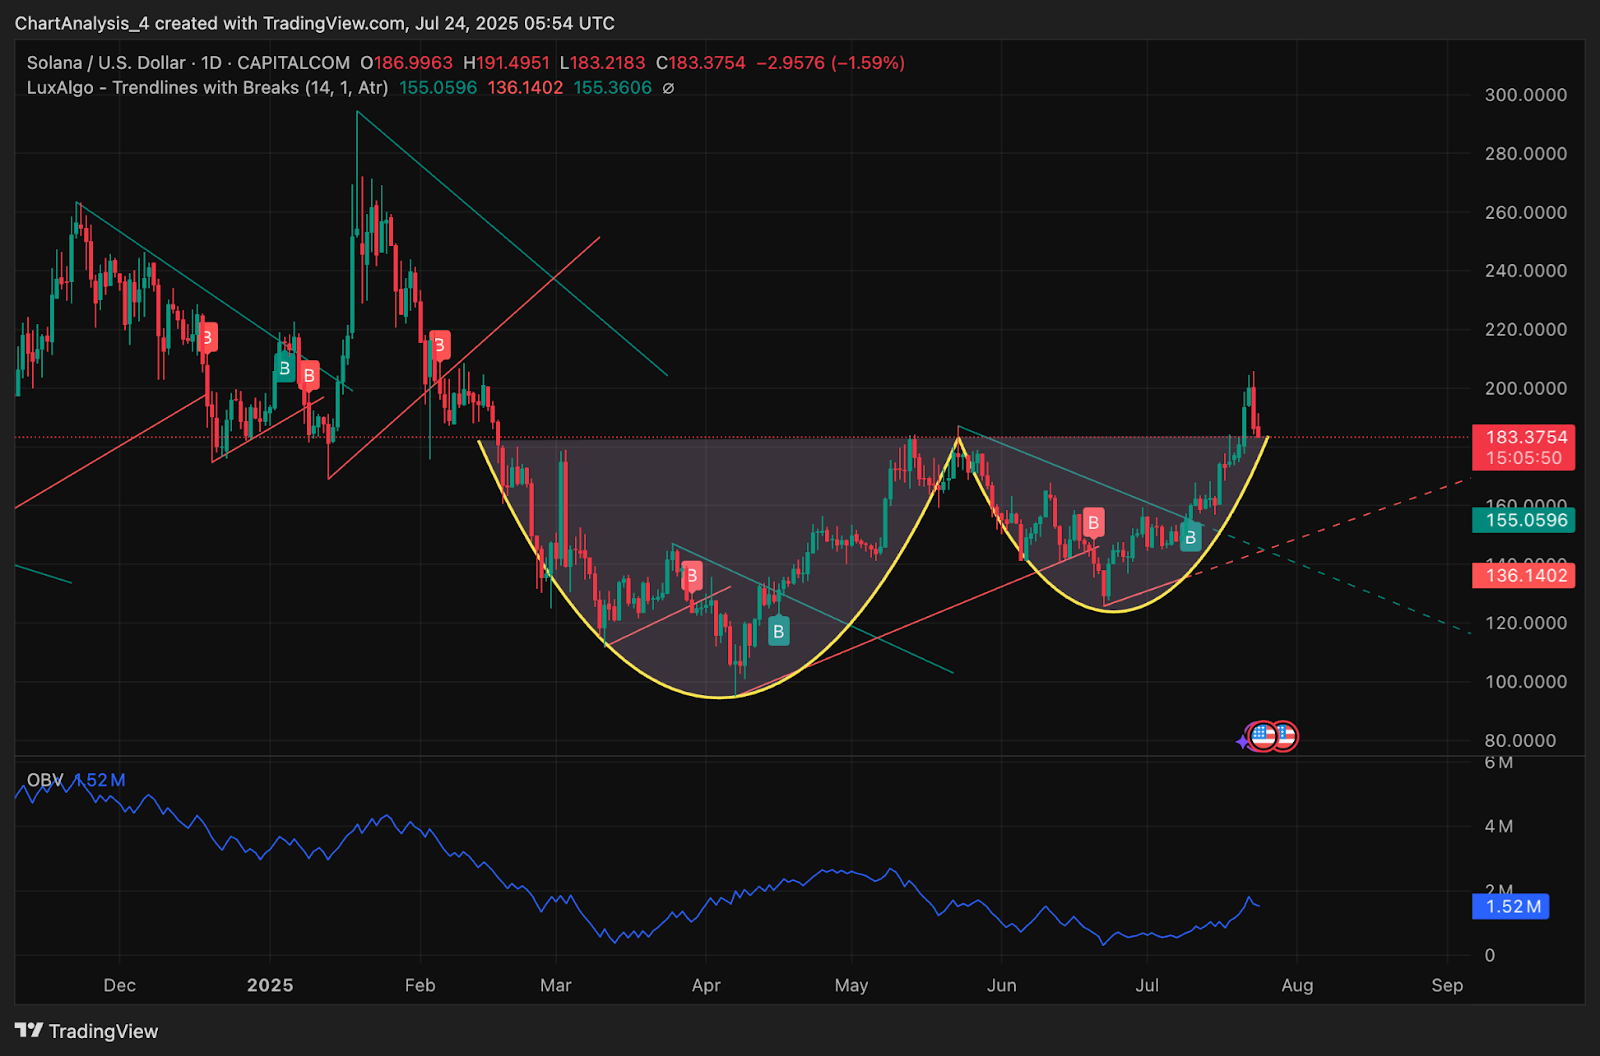
Technical Chartist Take: Reading the Price Action
From a chartist perspective, SOL’s price action around $185.23 reflects healthy consolidation after its recent push above $200. The volume surge coinciding with blockspace upgrades signals strong hands accumulating at these levels, especially as on-chain utility metrics continue to break records.
If you’re swing trading or running momentum strategies within the Solana ecosystem, keep your eyes on validator count trends and daily transaction numbers, they’re leading indicators for both price stability and breakout potential.
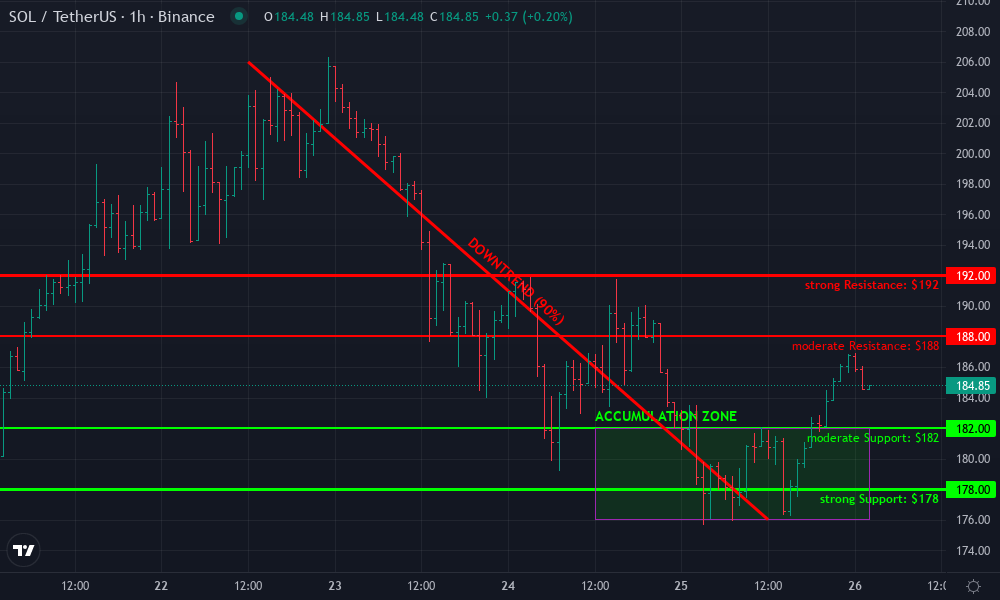
Solana Technical Analysis Chart
Analysis by Caleb Rowan | Symbol: BINANCE:SOLUSDT | Interval: 1h | Drawings: 6
Technical Analysis Summary
This chart displays a classic swing structure following a local top near $206, with a pronounced downtrend into the $176-$178 range, and a recent bounce toward current prices around $184.68. Draw a primary downtrend line from the July 22-23 local high ($206) down toward July 24-25 lows ($176). Mark horizontal support at $178 (recent swing low) and $182 (minor consolidation zone). Place resistance at $188 (previous support turned resistance) and $192 (structural pivot). Highlight the consolidation/accumulation range from $176 to $182. Mark a potential breakout arrow above $186.86 (recent high) and a breakdown arrow below $176. For aggressive entries, use a long position tool from $182 with stop below $178 and target at $192. Short setups would trigger below $178 with a stop at $184 and target at $170. Annotate volume surges if visible, and place MACD bullish/bearish crossover arrows based on momentum shifts. Use rectangles for price ranges and trend lines for direction.
Risk Assessment: medium
Analysis: The chart is coming off an aggressive downtrend, but with strong accumulation and reversal signs at the $176-$182 base. However, failure to reclaim $188/$192 will leave the setup vulnerable, and a breakdown below $178 could trigger high-volatility downside.
Caleb Rowan’s Recommendation: I’m sizing into aggressive swing longs here, but stops are tight below $178. If momentum fades or $188-$192 are rejected, I’ll be quick to reverse and short. Stay nimble — in these volatile conditions, discipline and risk management are everything. Charts never lie.
Key Support & Resistance Levels
📈 Support Levels:
-
$178 – Swing low and strong bounce zone
strong -
$182 – Minor support and recent consolidation base
moderate
📉 Resistance Levels:
-
$188 – Previous support, now acting as resistance
moderate -
$192 – Structural pivot and key swing high
strong
Trading Zones (high risk tolerance)
🎯 Entry Zones:
-
$182 – Aggressive long entry on reclaim and consolidation above support
medium risk -
$186.86 – Breakout long entry above recent local high
medium risk -
$178 – Aggressive short entry on breakdown below strong support
high risk
🚪 Exit Zones:
-
$192 – Profit target for longs, strong resistance
💰 profit target -
$176 – Profit target for shorts, previous low
💰 profit target -
$178 – Stop loss for longs, breakdown invalidates support thesis
🛡️ stop loss -
$184 – Stop loss for shorts, above consolidation
🛡️ stop loss
Technical Indicators Analysis
📊 Volume Analysis:
Pattern: Look for volume spikes on breakouts above $186.86 or breakdowns below $178
Volume confirmation is critical for validating momentum in either direction.
📈 MACD Analysis:
Signal: Watch for MACD bullish cross above $184 to confirm reversal, or bearish cross below $182 to confirm continuation.
MACD momentum is likely to signal early entries on range expansion.
Applied TradingView Drawing Utilities
This chart analysis utilizes the following professional drawing tools:
Disclaimer: This technical analysis by Caleb Rowan is for educational purposes only and should not be considered as financial advice.
Trading involves risk, and you should always do your own research before making investment decisions.
Past performance does not guarantee future results. The analysis reflects the author’s personal methodology and risk tolerance (high).
What Comes Next? Solana’s Scalability Roadmap
The pace of innovation shows no sign of slowing down. With SIMD-0286 under active review, further block capacity increases could hit mainnet before Q4 2025. Meanwhile, ongoing improvements to Jito Labs’ BAM protocol promise even finer-grained control over transaction sequencing, a crucial lever as new use cases like gaming, AI data feeds, and real-world asset tokenization come online.
The bottom line? Solana isn’t just keeping up with user demand, it’s pulling ahead of the curve by proactively scaling its technical stack. For traders, builders, and long-term holders alike, this means an ecosystem where liquidity begets opportunity, and where charts never lie about underlying strength.