In the summer of 2025, Bonk (BONK) has solidified its position as Solana’s top memecoin, capturing the attention of traders and analysts alike. With an exact current price of $0.00002572 as of July 13, BONK’s trajectory has become a focal point for those tracking Solana memecoin trends and risk-on sentiment in the broader crypto market. The surge is not just numerical; it reflects a confluence of technical breakouts, whale accumulation, and renewed retail enthusiasm across the Solana ecosystem.

BONK Price Analysis 2025: Breaking Out and Leading the Memecoin Rally
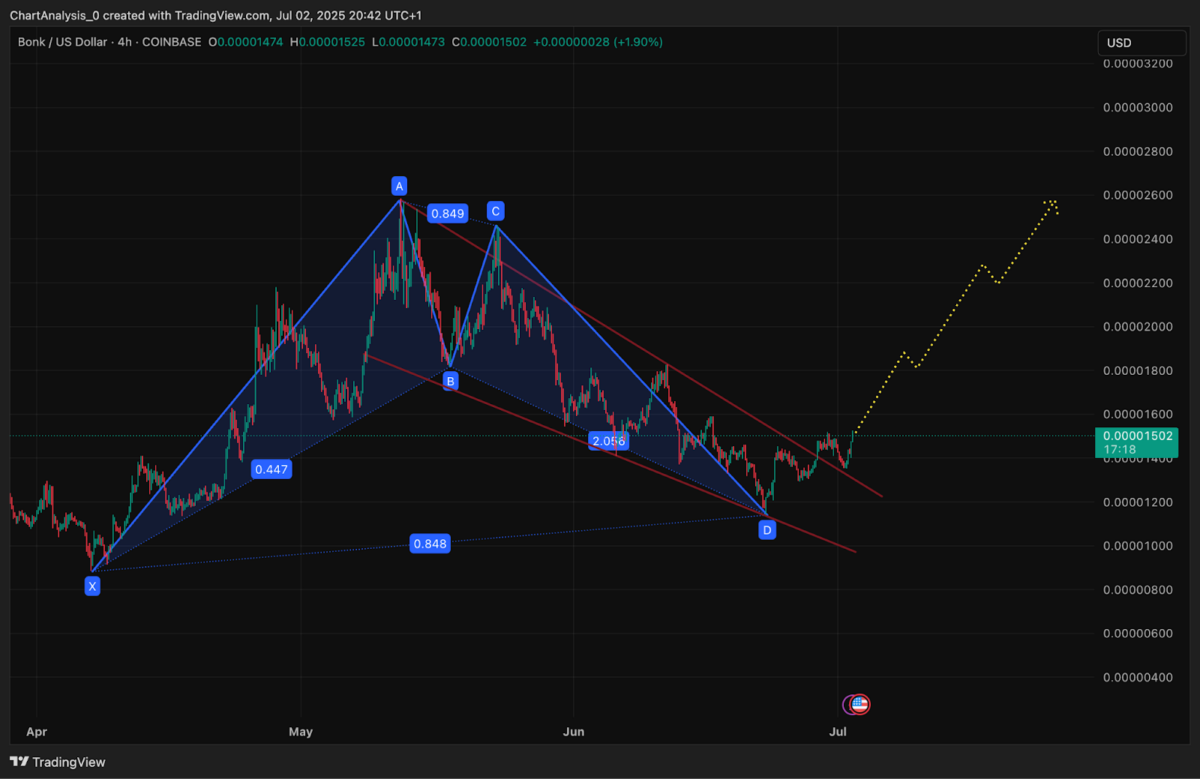
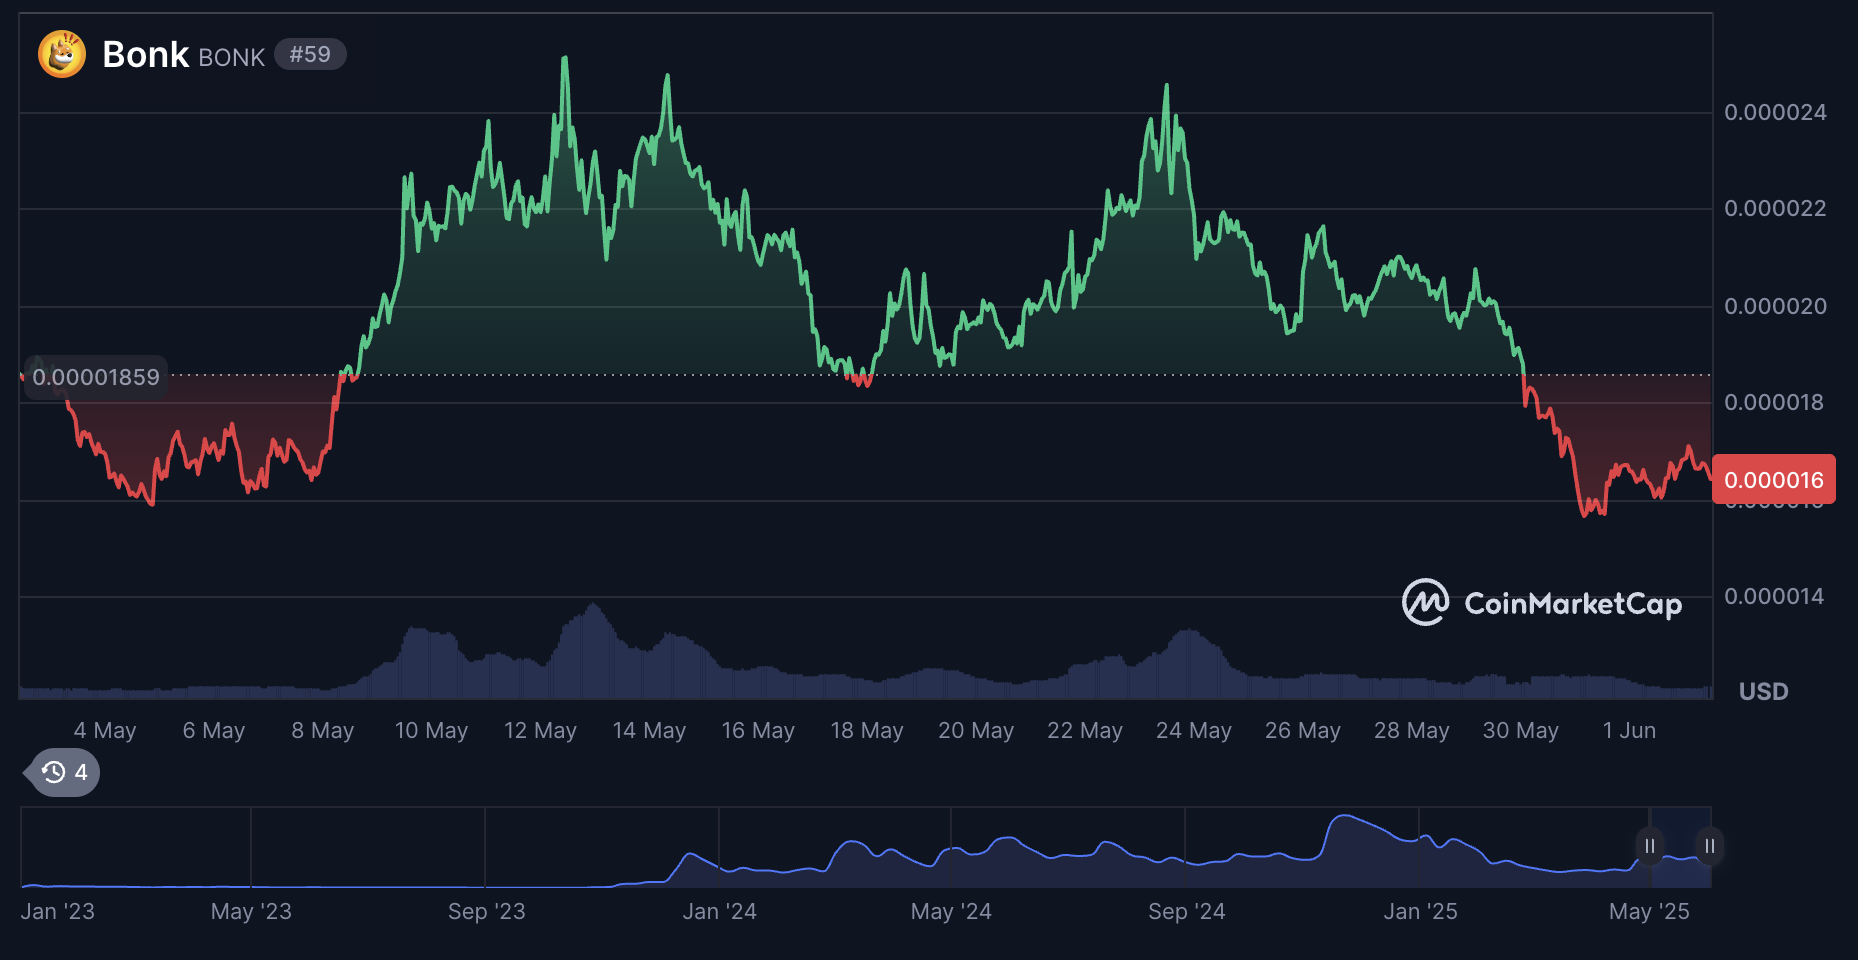
BONK’s journey in 2025 has been characterized by extreme volatility and rapid rebounds. After bottoming out at $0.000008815 in April (according to BanklessTimes), the token staged a remarkable comeback, more than doubling to its current level. This recovery was punctuated by a dramatic breakout from a descending wedge formation, a classic bullish reversal pattern that technical traders have watched closely.
“BONK is leading this altcoin rally right alongside Bitcoin’s own resurgence. It’s not just hype, on-chain data shows whales are accumulating aggressively. “
The broader context is equally important: The memecoin sector has seen its total market value soar to $55.51 billion, up 17.5% week-over-week (Cointelegraph). This surge underscores a shift toward high-beta assets as crypto investors rotate back into speculative plays, often led by Solana meme coins like BONK.
Technical Visuals: Charting BONK’s Breakout Above $0.00002572
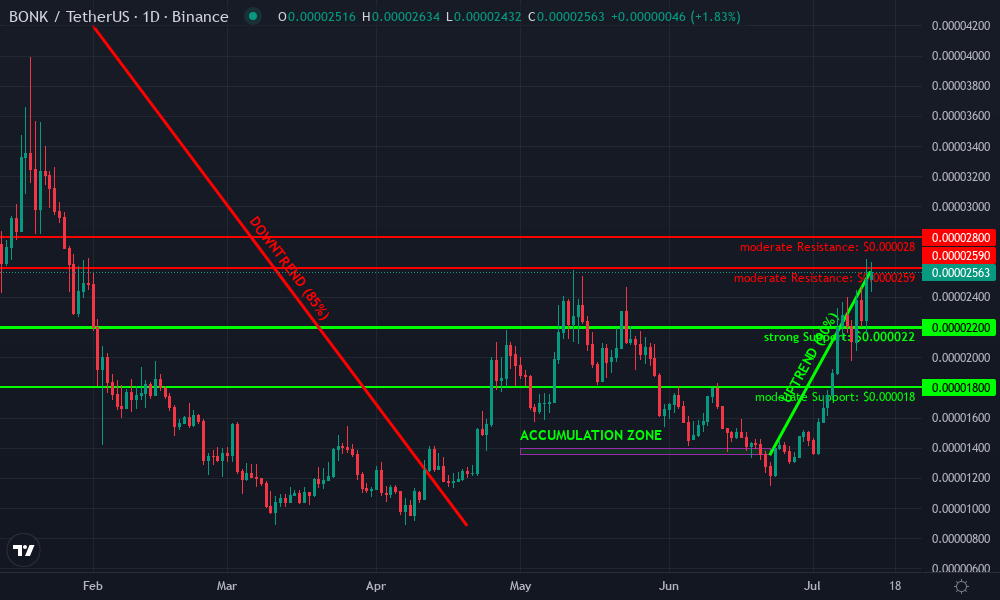
The most compelling evidence of BONK’s momentum comes from its price chart. As of July 13, the token has decisively broken above key resistance at $0.00002590, with intraday highs at $0.00002624 suggesting further upside potential if bullish volume persists (The Market Periodical). Technical analysis points to $0.00003440 as the next major target if buyers maintain control.
Bonk Technical Analysis Chart
Symbol: BINANCE:BONKUSDT | Interval: 1D | Drawings: 7
Technical Analysis Summary
The BONKUSDT daily chart in 2025 shows a strong recovery after a long multi-month downtrend and consolidation. The price has surged since late June, breaking above prior resistance and currently testing the $0.00002569-$0.00002600 zone. This coincides with a breakout from a descending wedge and a rally supported by increased volume and accumulation. The next visible resistance is near $0.00002800 and $0.00003440, while strong support lies at $0.00002200 and $0.00001800. The trend has shifted bullish, and further upward momentum is likely if BONK holds above $0.00002590. A short-term consolidation or pullback is possible before the next leg up. Drawing horizontal lines at support/resistance, trend lines for the breakout, and using volume/MACD indicators for confirmation is recommended.
Key Support & Resistance Levels
Support Levels:
- $0 – Recent breakout level and former resistance, now acting as support. (strong)
- $0 – Middle of prior consolidation range, secondary support. (moderate)
Resistance Levels:
- $0 – Immediate resistance, current price area, former swing high. (moderate)
- $0 – Next resistance, recent local high from earlier in the year. (moderate)
- $0 – Major resistance, target from technical breakout. (strong)
Trading Zones
Entry Zones:
- $0 – Pullback to breakout support and confirmation of uptrend. (Risk: medium)
- $0 – Break and hold above current resistance signals momentum continuation. (Risk: high)
Exit Zones:
- $0 – First profit target at next resistance. (profit_target)
- $0 – Second profit target at major resistance. (profit_target)
- $0 – Stop loss below recent support for risk management. (stop_loss)
Technical Indicators Analysis
Volume Analysis:
Pattern: Volume appears to have increased during breakout and rally, confirming the bullish move.
Description: Rising volume supports the breakout and trend reversal.
MACD Analysis:
Signal: Bullish crossover likely, momentum to the upside.
Description: MACD would likely show a bullish crossover and increasing momentum in this uptrend phase.
Applied Drawing Utilities
This chart uses the following TradingView drawing utilities:
- Trend Line
- Horizontal Line
- Rectangle
- Text
- Callout
- Arrow Marker
Disclaimer: This technical analysis is for educational purposes only and should not be considered as financial advice.
Trading involves risk, and you should always do your own research before making investment decisions.
Past performance does not guarantee future results.
Volume remains a critical indicator here: BONK saw a massive spike to 2.9 trillion tokens traded amid speculation around a potential ETF launch and news of an imminent token burn event (CoinDesk). These catalysts have helped drive both spot price action and derivatives open interest higher, fueling short-term rallies and longer-term optimism alike.
Whale Accumulation and Smart Money Flows Fueling Momentum
Perhaps most telling for BONK’s sustained rise is the behavior of large holders: In the last month alone, the top 100 addresses grew their holdings by 3.56%, now controlling over 56.35 trillion tokens. This pattern suggests that institutional players and crypto-native funds see further upside in Solana meme coins for 2025.
Key Drivers Behind Whale Accumulation in BONK (Summer 2025)
-
Breakout Above Technical Resistance: BONK recently broke out of a descending wedge pattern, signaling a potential bullish reversal. This technical breakout, confirmed by the token’s move above the key resistance level at $0.00002590, has attracted significant whale interest seeking upside momentum.
-
Surge in Trading Volume and Open Interest: BONK’s trading volume and futures open interest have surged alongside price, indicating heightened institutional and whale activity. The top 100 addresses now hold over 56.35 trillion BONK, up 3.56% in the last 30 days, reflecting aggressive accumulation by large holders.
-
Broader Memecoin Market Rally: The total memecoin market cap has climbed to $55.51 billion (up 17.5% in the past week), boosting risk appetite for assets like BONK. Whales are positioning early to capitalize on sector-wide bullish sentiment.
-

Speculation Around ETF Launch and Token Burns: Rumors of a potential BONK-related ETF and recent large-scale token burns (including a 1 trillion token burn) have fueled optimism. These events enhance BONK’s scarcity narrative, making it more attractive for large-scale investors.
-
Strength in the Solana Ecosystem: BONK’s close association with the Solana blockchain, which continues to show resilience and innovation, has reinforced confidence among whales. As Solana remains a hub for memecoin activity, BONK is seen as a leading beneficiary.
This strategic accumulation aligns with data showing increased futures open interest, a sign that sophisticated traders are positioning for continued volatility (and possibly new all-time highs). With such heavyweights entering or expanding their stakes in BONK, retail sentiment has followed suit, creating a feedback loop that propels prices higher even as analysts debate how long this rally can last.
Bonk (BONK) Price Prediction 2026–2031
Professional outlook based on current 2025 market trends, technical analysis, and fundamental factors
| Year | Minimum Price | Average Price | Maximum Price | Year-over-Year Change (Average) | Market Scenario Insights |
|---|---|---|---|---|---|
| 2026 | $0.000016 | $0.000031 | $0.000052 | +20.5% | Potential retracement early in the year, followed by steady growth if memecoin trend persists. Bearish min reflects risk of post-rally correction. |
| 2027 | $0.000012 | $0.000029 | $0.000062 | -6.5% | Increased competition in memecoins and regulatory tightening could weigh on price; bullish scenario assumes further Solana ecosystem expansion. |
| 2028 | $0.000014 | $0.000038 | $0.000079 | +31.0% | Renewed altcoin cycle and broader crypto adoption could propel BONK higher. Upside driven by new use cases or major token burns. |
| 2029 | $0.000019 | $0.000047 | $0.000095 | +23.7% | Memecoin sector matures; BONK benefits from strong community and integration with Solana DeFi/NFT platforms. Max price assumes sustained hype. |
| 2030 | $0.000025 | $0.000058 | $0.000115 | +23.4% | If bullish cycle continues, BONK could approach previous speculative highs. Bearish scenario reflects potential for sector rotation or regulation. |
| 2031 | $0.000021 | $0.000053 | $0.000128 | -8.6% | Market stabilization or correction after extended growth. Average price remains well above 2025 levels, but volatility persists. |
Price Prediction Summary
Bonk (BONK) is expected to experience continued volatility but with an overall upward trend over the next six years. While short-term corrections are likely, especially after periods of rapid growth, the long-term outlook remains positive if memecoin and Solana ecosystem adoption persists. Peak prices may be reached during speculative rallies fueled by market sentiment, token burns, or new use cases, while downside risks include regulatory crackdowns and increased competition.
Key Factors Affecting Bonk Price
- Solana network growth and performance
- Memecoin market cycles and investor sentiment
- Regulatory actions affecting memecoins
- Token burn events and supply reductions
- Integration with DeFi/NFT platforms
- Competition from other high-profile memecoins
- Broader cryptocurrency market trends and Bitcoin price action
Disclaimer: Cryptocurrency price predictions are speculative and based on current market analysis.
Actual prices may vary significantly due to market volatility, regulatory changes, and other factors.
Always do your own research before making investment decisions.
Market psychology has played an outsized role in BONK’s 2025 ascent. The token’s rapid climb from its April low to the current $0.00002572 is not merely a function of technical patterns or whale behavior, but also a reflection of shifting sentiment across the Solana ecosystem. As mainstream attention returns to crypto, retail traders are increasingly drawn to visual cues like breakout charts and surging volume, reinforcing bullish narratives and amplifying momentum.

This year’s Solana memecoin surge is also part of a broader trend: risk-on appetite is back, with investors seeking out volatile assets capable of outsized returns. BONK’s performance has consistently outpaced rivals such as DOGE and WIF in recent weeks, thanks to its unique combination of community engagement, high-profile tokenomics events (including the much-discussed trillion-token burn), and speculative buzz around ETF launches. These factors have made it the poster child for Solana meme coins in 2025.
Visualizing BONK’s All-Time High Potential
With strong on-chain signals and technical breakouts in play, analysts are split on just how high BONK can go this cycle. Some forecasts see the token targeting $0.00003440 in the near term if current momentum holds (The Market Periodical). More aggressive models, factoring in continued whale accumulation and successful execution of upcoming burns or ETF news, suggest even higher upside by year-end.
“BONK’s price action is a masterclass in memecoin liquidity cycles, each catalyst compounds on-chain flows and FOMO-driven demand. ”
Will BONK break above $0.00003440 before September 2025?
BONK is currently trading at $0.00002572 after a strong rally in 2025, with technical analysis pointing to $0.00003440 as the next key resistance. With whale accumulation and the memecoin market surging, do you think BONK will surpass this level before September?
The path forward is not without risks. Volatility remains extreme, with sharp pullbacks possible if market sentiment sours or if major holders decide to take profits en masse. Still, as long as Solana trading visuals continue to show robust volume and positive technical setups, BONK appears poised to remain at the forefront of Solana memecoin trends for 2025.
Top Three Risks Facing BONK Holders in H2 2025
-
High Volatility and Speculative Swings: BONK, like most memecoins, is subject to extreme price fluctuations. Despite trading at $0.00002572 as of July 13, 2025, rapid surges and sharp corrections are common, making it risky for holders seeking stability.
-

Concentration of Holdings Among Whales: Over 56.35 trillion BONK—a significant portion of the circulating supply—is controlled by the top 100 addresses. This concentration increases the risk of price manipulation or sudden sell-offs, which could negatively impact retail investors.
-
Dependence on Solana Network Stability: BONK’s performance is closely tied to the health of the Solana blockchain. Any technical issues, network outages, or security breaches on Solana could directly affect BONK’s price and liquidity.
Solana Meme Coins 2025: Lessons from the BONK Rally
BONK’s rise offers several key takeaways for traders watching Solana meme coins this year:
- Technical patterns matter: Visual confirmation of breakouts drives both algorithmic and discretionary trading flows.
- Whale activity sets the tone: Sustained accumulation by large holders attracts retail interest and underpins major rallies.
- Community catalysts amplify moves: Events like token burns or ETF rumors can rapidly shift sentiment and volume.
BONK’s ability to reclaim, and hold, levels above $0.00002572 will depend on these dynamics remaining favorable over the coming months. For now, all eyes are on whether it can convert this breakout into a sustained move toward new all-time highs.